How to Create a Salesforce Report


Casey O'Connor
A Salesforce report is a gathering of data based on metrics and criteria you define within the software. A report is generated by organizing the desired data into rows and columns.
Salesforce reports can give valuable insights into the health of a sales team and the sales process. They can also be used as inputs for graphical dashboard displays.
In this article, we’ll go over everything you need to know about Salesforce reports: the different types, how to create them, and how to leverage them to improve decision-making.
Here’s what we’ll cover:
- What Is Salesforce?
- Common Salesforce Report Types
- The Difference Between a Salesforce Report and Sales Dashboard
- Metrics to Measure in a Salesforce Report
- How to Create a Custom Salesforce Report
- Integrations to Measure Your Sales Performance in Salesforce
What Is Salesforce?
Salesforce is one of the world’s leading customer relationship management (CRM) software platforms.
Salesforce software is used by sales teams all over the world to:
- Engage and nurture customers with highly relevant, personalized content and customer service
- Improve workflow by automating tasks that would otherwise take valuable selling time away from sales reps
- Create custom reports that drive decision-making and enable businesses to grow and scale
Salesforce is a powerful tool that seamlessly unites marketing, sales, customer service, and IT teams. It offers the ability to analyze sales data with real-time, up-to-the-minute updates, which sales managers and leaders can take advantage of to track their progress towards goals.
Put simply, Salesforce is a technology for managing all of your company’s relationships and interactions with customers and potential customers. It is designed to help businesses be successful by facilitating and creating meaningful connections with their clients and prospects.
Common Salesforce Report Types
One of the most popular Salesforce features is its ability to create custom reports based on sales data inputs.
A Salesforce report is a visualization of data based on specific criteria and a timeframe defined by the user. Salesforce data can be displayed in reports in rows or in columns (or both), and users have various access levels available to them. Salesforce reports live inside report folders, which can be public, shared, or hidden, and can be enabled with either read-only or editing access.
There are four main types of Salesforce reports: Tabular, Summary, Matrix, or Joined. Each report format offers a unique way to represent data depending on your analysis needs.
Tabular Report
The Tabular report is the simplest report template available in Salesforce. It organizes report data into rows. Tabular reports are similar to Excel spreadsheets, and contain organized fields of records. They’re best used for creating a single list of records, or a grand total.
Tabular reports cannot be used to create a group of charts, or compare various totals against one another.
Summary Report
A Summary report is similar to a Tabular report, but more powerful. With a Summary report, the user has the ability to group rows of data and create charts. Summary reports are the most commonly used type of report.
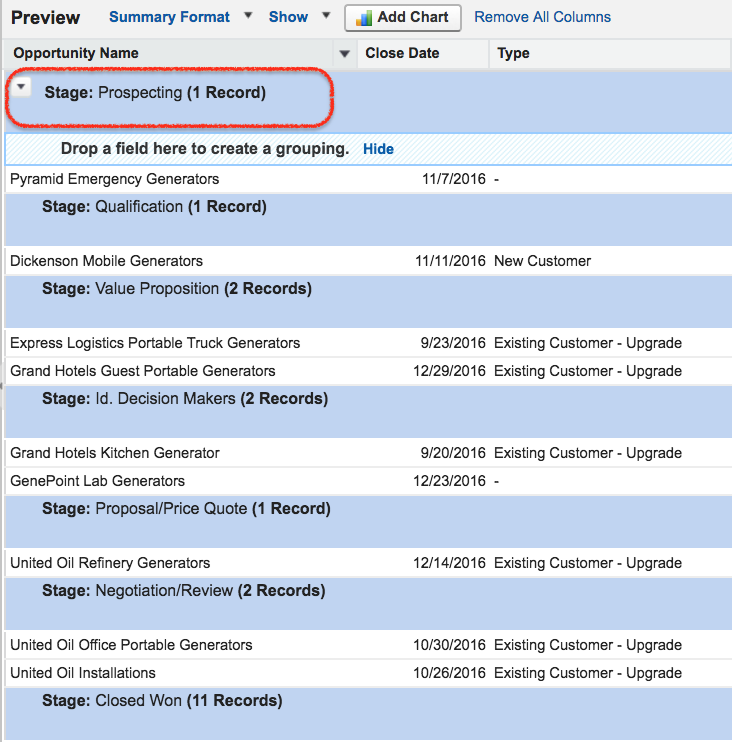
In the report depicted above, for example, the data rows are grouped based on opportunity stage. In Summary reports, grouping is done based on the value of a selected field. Summary reports can also be used to create subgroups and to visualize data subtotals.
Matrix
Matrix reports are slightly more complicated than Summary or Tabular ones, and are used when you need to group data into both rows and columns. The Matrix report below shows data based on date and on stage.
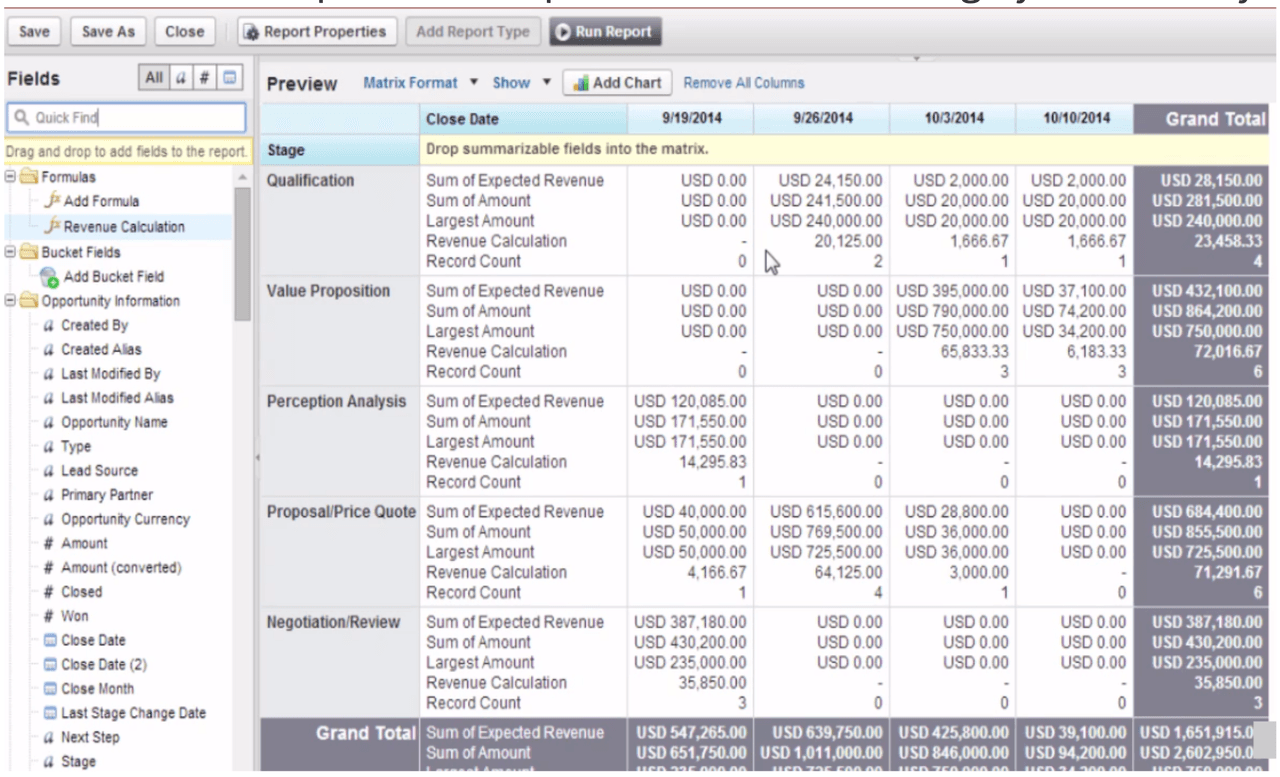
Matrix reports give you the ability to see data from two different dimensions that aren’t necessarily related. You can use this report type to see and compare different totals from your data.
Joined Reports
The last type of report is called a Joined report, and is used to compare the data of one or more reports. In other words, a Joined report takes two or more separate reports and compares them.
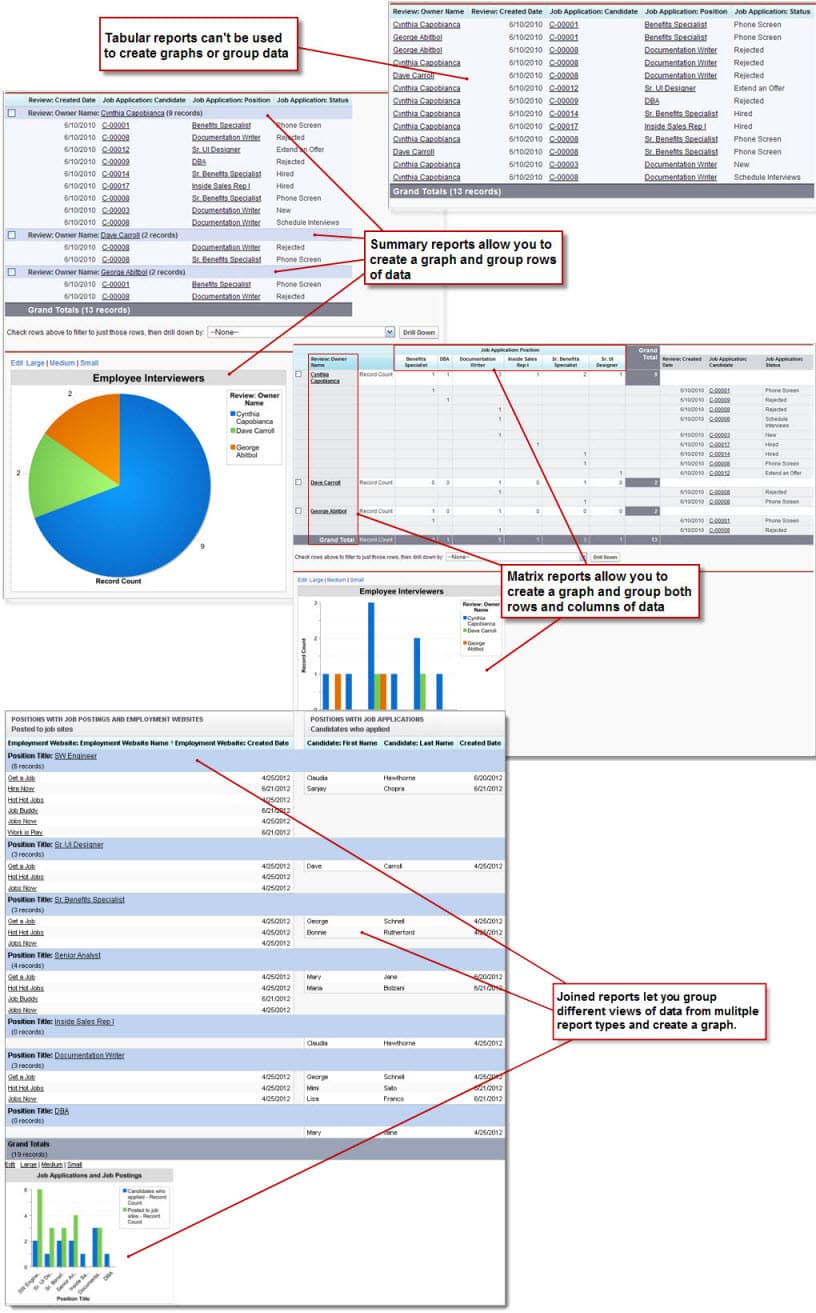
Joined reports allow you to look at summarized data across a variety of fields.
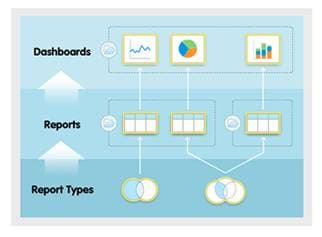
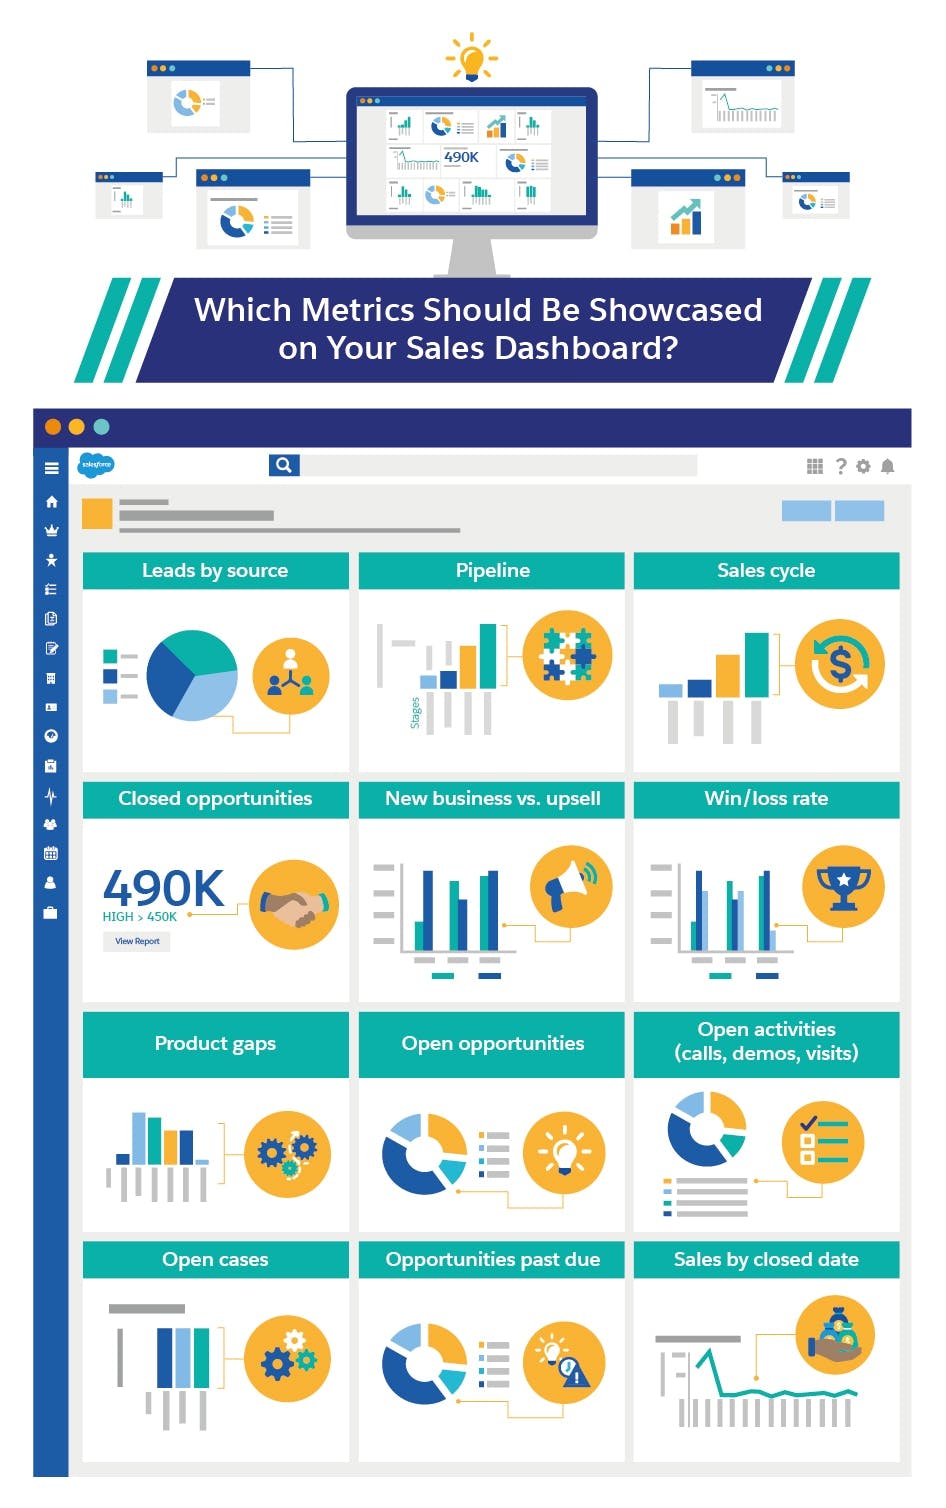
The Difference Between a Salesforce Report and Sales Dashboard
Although Salesforce reports offer one way to visualize data, they’re not quite the same as a sales dashboard. Instead, reports are the data points that feed into a dashboard.
A single report generates the graphic for a single dashboard component. You can use multiple reports to generate a multi-component dashboard. Alternatively, a single report can also be used to generate multiple representations of the same data (i.e., one single report can be shown on the dashboard via pie chart, bar graph, and trend line).
The process of creating a dashboard using your reports is a simple one. Start by navigating to the Reports tab, then click New Dashboard. From there, you can select the components you would like displayed on your dashboard; simply drag and drop to add them.
Metrics to Measure in a Salesforce Report
Salesforce reports can be used to summarize a number of different data points and key metrics. At least one of the four types of reports is likely to be capable of displaying the KPIs that matter most to your business.
If you’re not sure where to start, consider your company’s top priorities and goals. This will give you some insight into which metrics are most important to your bottom line. The following KPIs are some of the most popular for Salesforce reports.
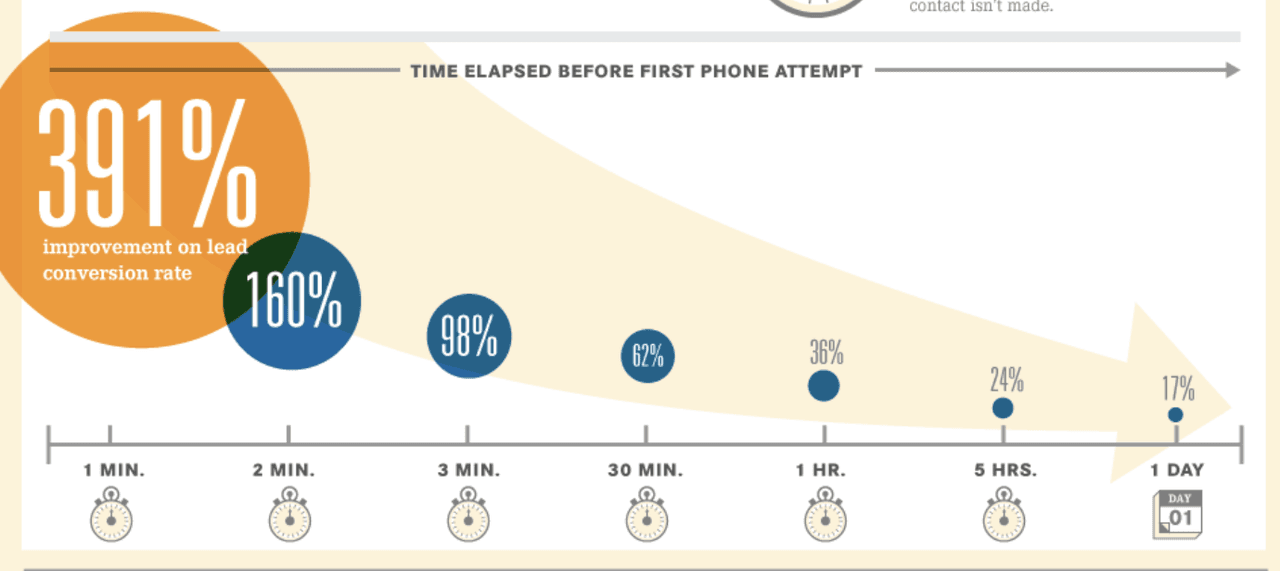
Lead Response Time
Lead response team refers to how quickly your sales reps respond to or follow up with a potential client. Data shows that the more quickly your team can respond to leads, the more likely they are to become qualified.
Follow-up Rate
Even more specific than lead response time is your follow-up rate. The data around following up shows that many salespeople are abandoning leads far too quickly; the average prospect requires up to 5 follow-ups before they move to the next stage, yet nearly 50% of sales reps give up after the first try.
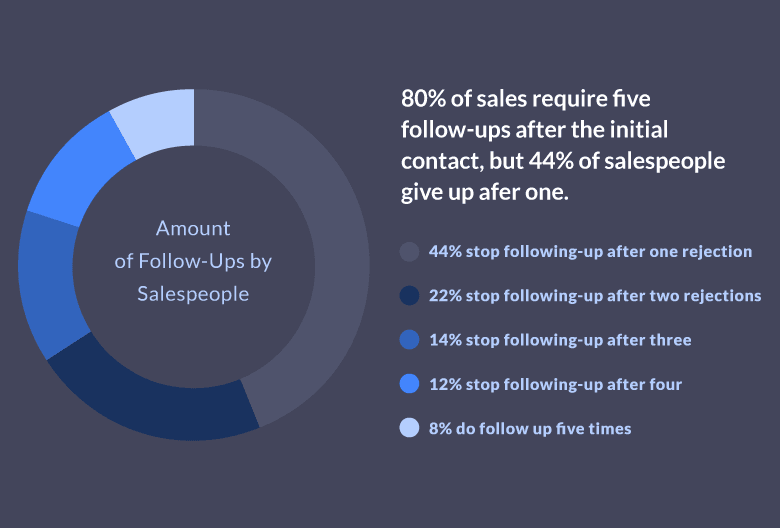
Any of the standard reports outlined above will give you a good snapshot of how persistent your sales team is willing to be to capture a lead.
Sales Activity
It’s no secret that salespeople today are busier than ever. In fact, only 36% of a salesperson’s time is spent on selling activities.
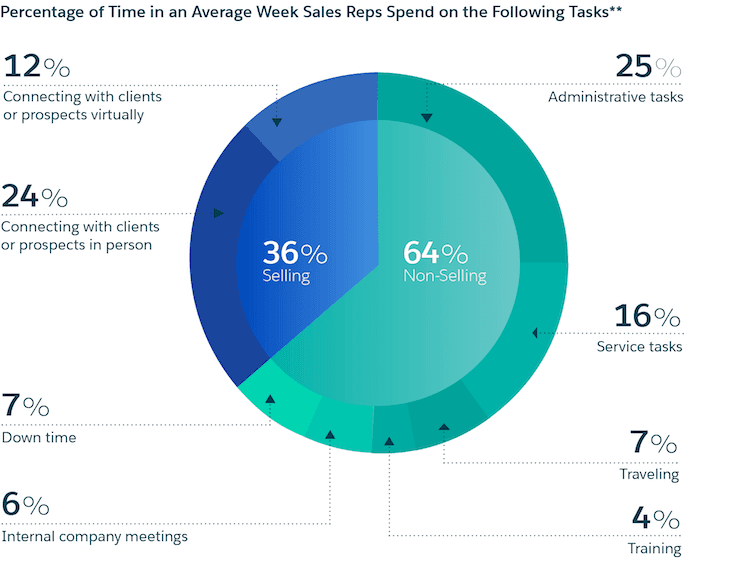
A Salesforce report on sales activities can provide an excellent snapshot into your team’s sales productivity to better optimize their workflow.
Lead-to-Opportunity Ratio
Your lead-to-opportunity ratio is the percentage of leads that you successfully convert to opportunities. This metric will help you understand how effective your lead-nurturing strategies are.
Lead Conversion Rate
This metric represents the proportion of qualified leads that result in sales. Your lead conversion rate can offer a high-level view of how well your pipeline runs as a whole.
Number of Demos
You can also use Salesforce reports to track reps’ and prospects’ behavior around demos. Not only can you use reports to track how often your reps are presenting demos, but you can also infer which subsets of customers are most likely to close after a demo by running a Matrix or Joined report.
Other metrics that you might consider analyzing via Salesforce reports are:
- Average contract value
- Number of inbound leads
- Cold calling stats
Remember that all of this data and reporting can then be used to generate a streamlined dashboard, so you can view all of your data in one place.
 How to Create a Custom Salesforce Report
Creating a custom Salesforce report is simple using the following steps:
- Go to the Reports tab.
- Click New Report.
- Select the custom object you’d like to create a report on.
- Click Create.
- Add Filter, Properties, and Fields as needed to show your data.
- Select your report type.
- Click Save As.
- Click Run Report.
These steps can be followed to create virtually limitless custom report types. The ability to create custom fields and inputs will allow your team to look at data in a variety of page layouts and representations for the best understanding of the data.
Integrations to Measure Your Sales Performance in Salesforce
There are a number of platforms that offer integration with Salesforce. Here are a few of our favorites.
Yesware
Yesware helps you automate your data entry and get better sales insight with very little effort. Yesware’s Salesforce Sidebar shows a contact’s recent activity directly within your inbox, so you can create outreach to nurture them exactly where they are in the sales process.
Rapidi
With no programming required, Rapidi offers easily customizable data integration. The data is continuously synchronized, and the platform offers automation of cross-system processes. It also allows you to store and display the most meaningful customer data wherever you need it most.
Commercient
Commercient offers a plethora of ready-made templates and customizable timeframes for syncing. That being said, there is some development and programming required for businesses looking for non-standard templates.
Mulesoft
Mulesoft’s integrations can err on the more complex side, making it best for larger enterprise companies with IT services at the ready. That being said, the integration capabilities are quite powerful, and can connect Salesforce with a large number of different applications.
Get sales tips and strategies delivered straight to your inbox.
Yesware will help you generate more sales right from your inbox. Try our Outlook add-on or Gmail Chrome extension for free, forever!
Related Articles


Casey O'Connor

Casey O'Connor

Casey O'Connor
Sales, deal management, and communication tips for your inbox