How Weather Affects Email Productivity [New Data From 40M Emails]

![How Weather Affects Email Productivity [New Data From 40M Emails]](/blog/_next/image/?url=https%3A%2F%2Fwww.yesware.com%2Fwp-content%2Fuploads%2F2019%2F05%2Fweather-vs-productivity.jpg&w=1984&q=75)

Gwen Lamar
You can’t control the weather, but weather can control your productivity.
Which is why we analyzed the email habits of ~28k Yesware users in the top 10 U.S. cities to see how weather impacts the way you work.*
What it means for you: A competitive email advantage. By understanding the weather patterns of these cities, you’ll know when you’re most likely to get replies.
Know when you’re the most productive by tracking your own emails.
Productivity vs. Precipitation: Rain Isn’t Always a Bad Thing
Rain has a bad reputation.
Which is why we originally thought we’d see more rain lead to fewer emails being sent, regardless of location.
We were wrong.
Here are the two major lessons we learned.
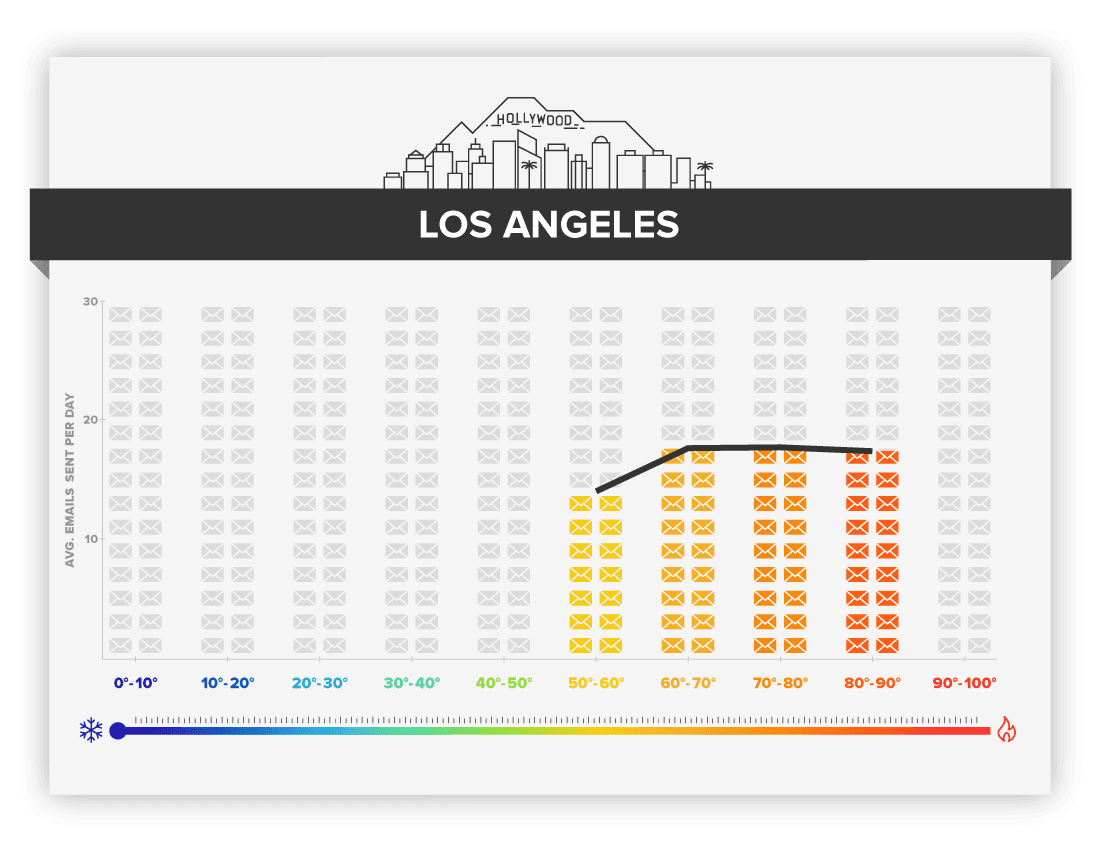
Lesson #1: When it rains it pours — at least in Los Angeles, Phoenix, and Austin.
Our first group of cities sent fewer emails when any type of rain occurred:
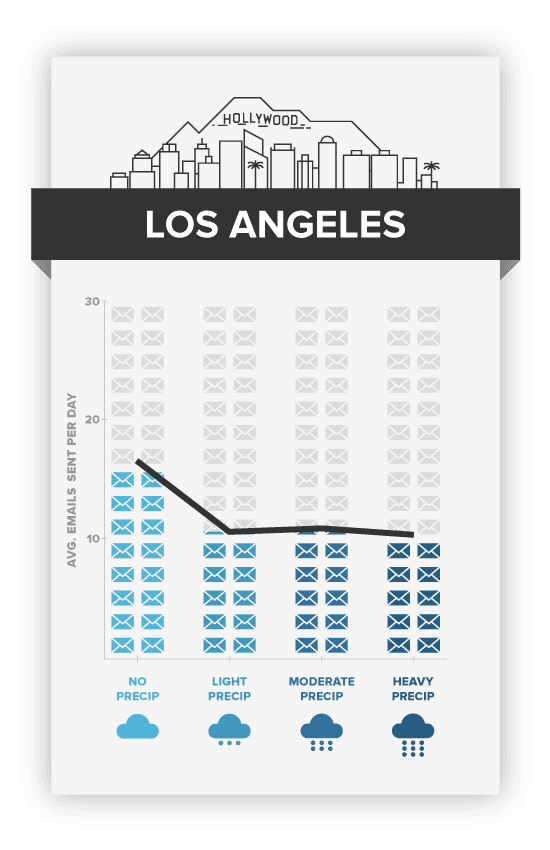
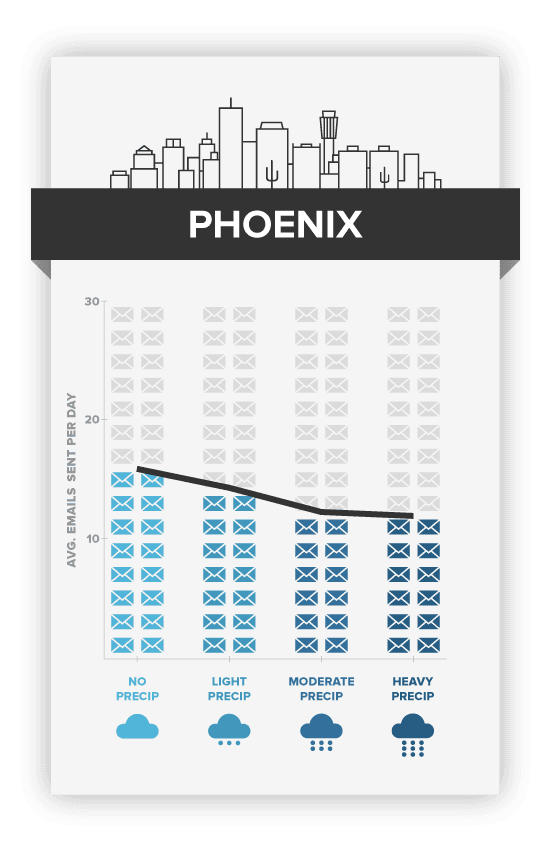
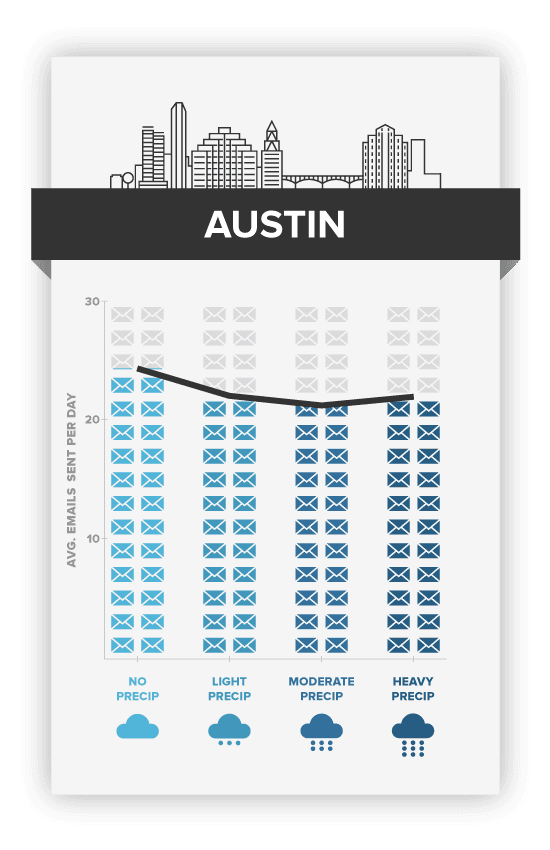
Takeaway: This may have something to do with the fact that rain is scarce in these areas, so when it finally does occur, fewer emails are sent.
Lesson #2: Heavy showers boost productivity in these 6 cities.
On the flip side, major cities like Boston, New York, Chicago, Washington, San Francisco and Seattle were more productive during heavy rainfall:
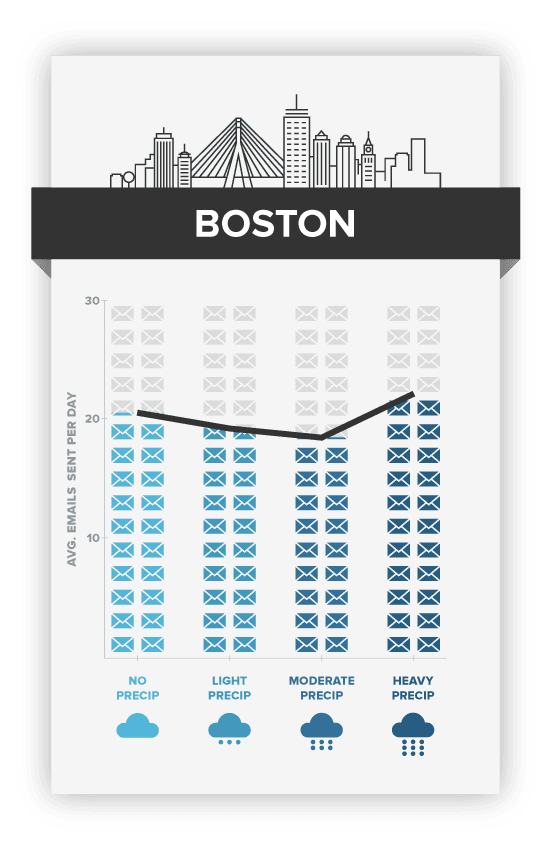
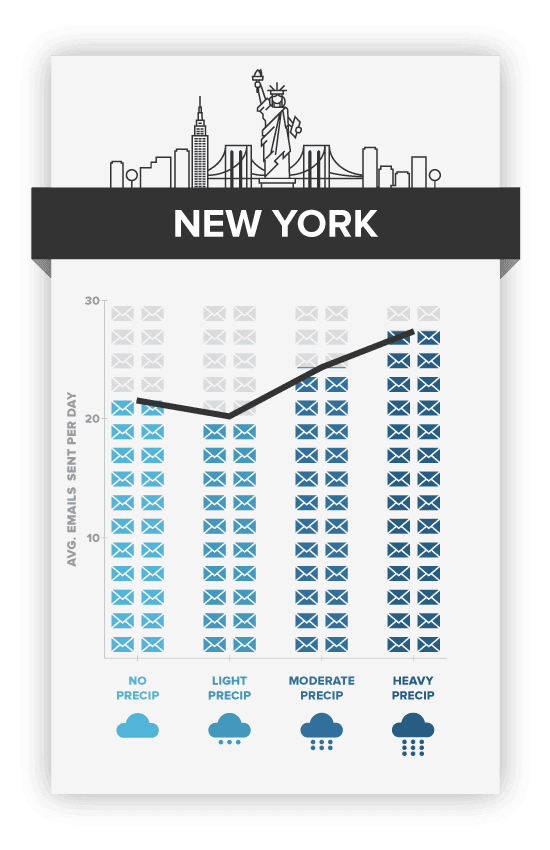
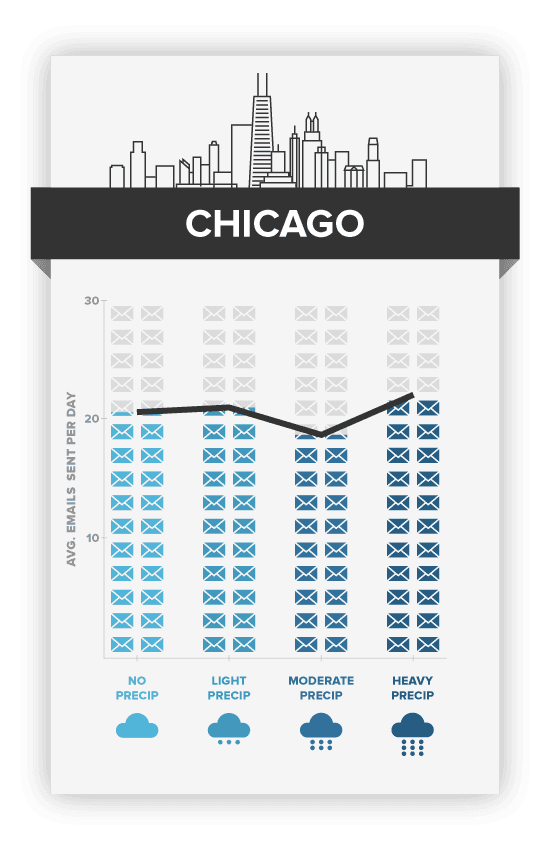
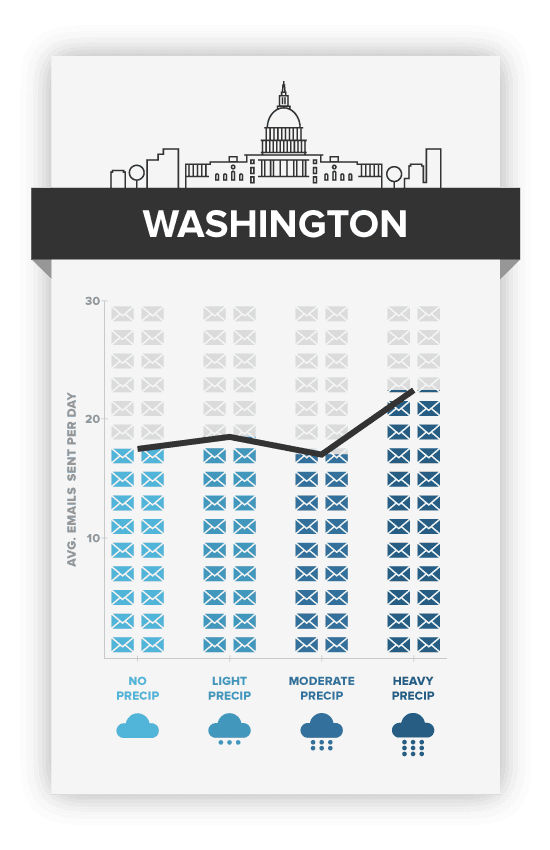
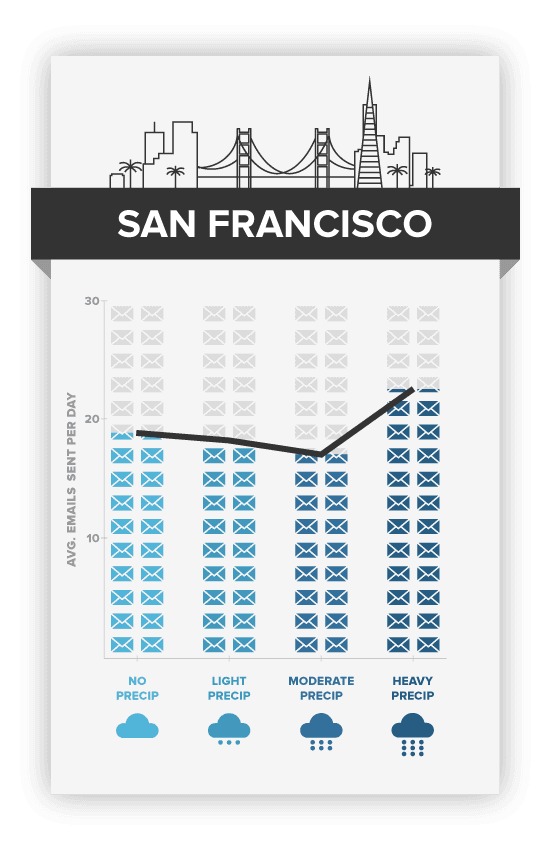
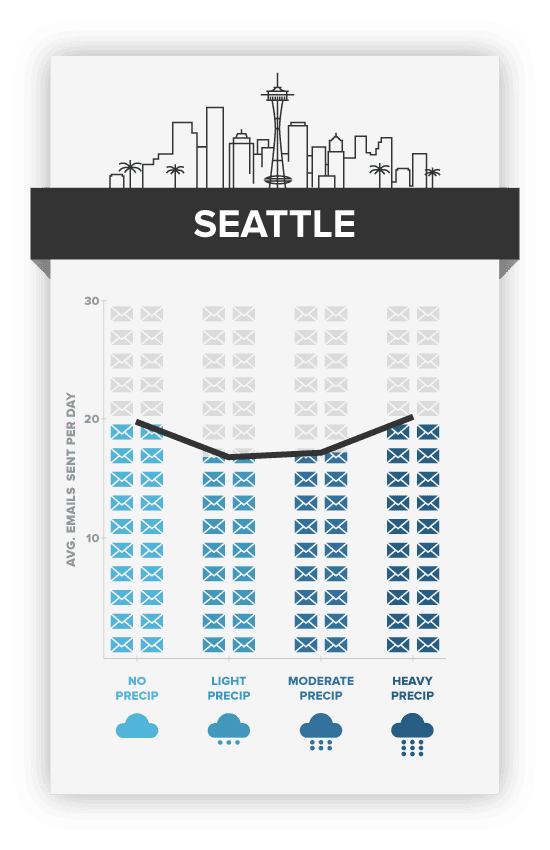
Takeaways: Our best guess is that heavy precipitation doesn’t affect these cities because there’s a different workplace culture. Each of these cities were ranked in a 2017 study of the hardest-working cities in America, meaning that heavy rain won’t get them down.
Our users save 70 hours per month with inbox productivity tools.
Some Like It Hot. Some Like It Cold. Then There’s Boston.
Next up, how temperature affected users.
We found two significant trends among six cities. Then, Boston decided to do it’s own thing.
Here’s what we found.
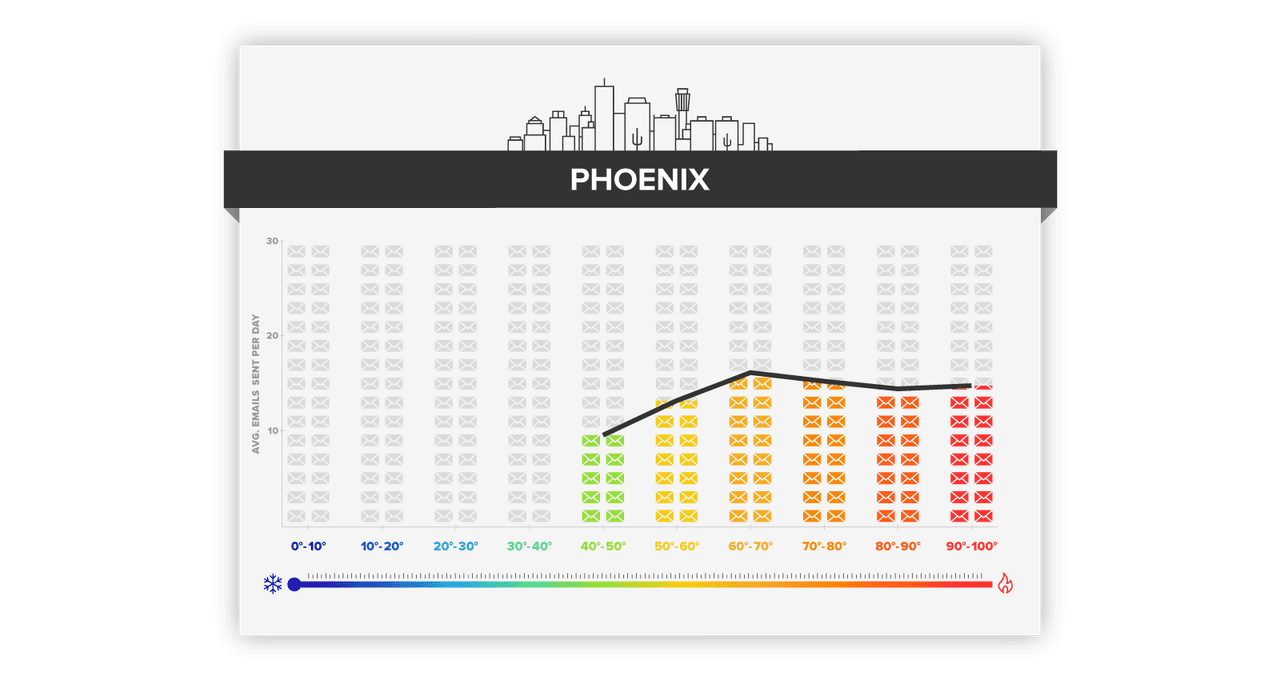
Lesson #1: In most cities, fewer emails are sent when the temperature drops.
We all know the feeling. The weather turns cold and you want nothing more than to lay underneath your warmest blanket. At least, that’s the case in these four cities:
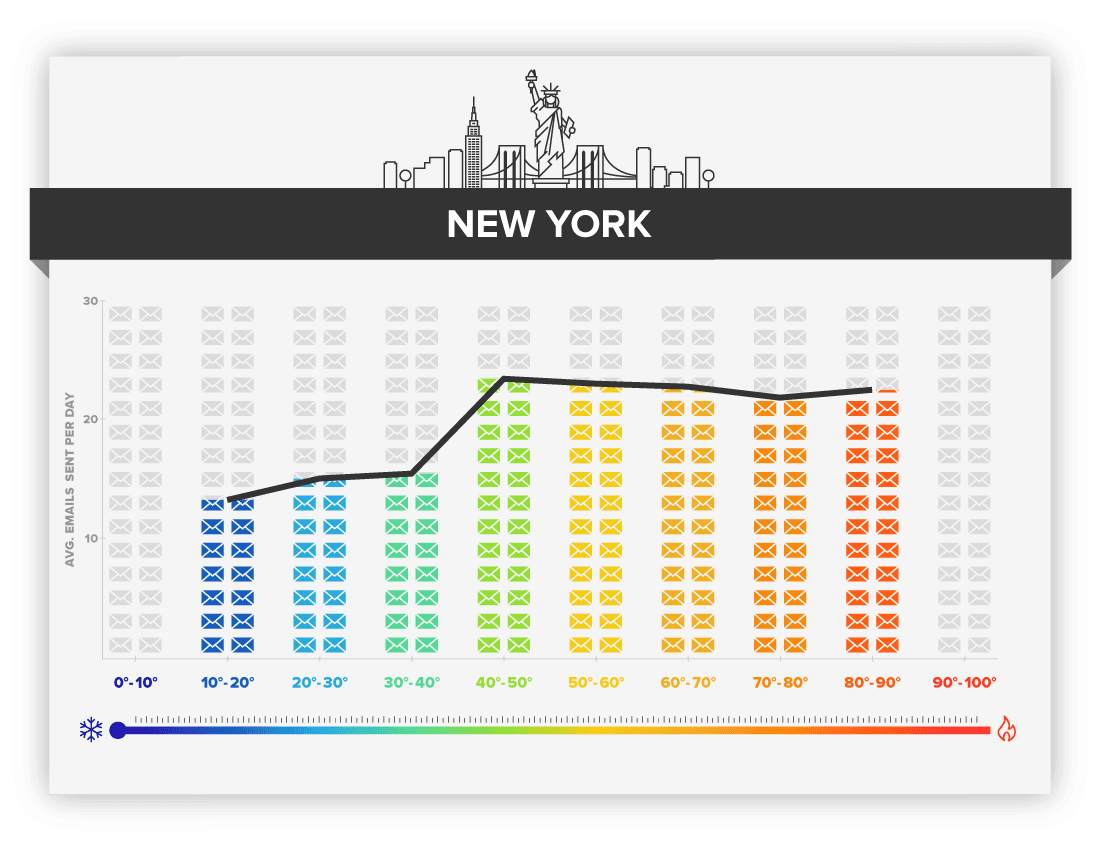
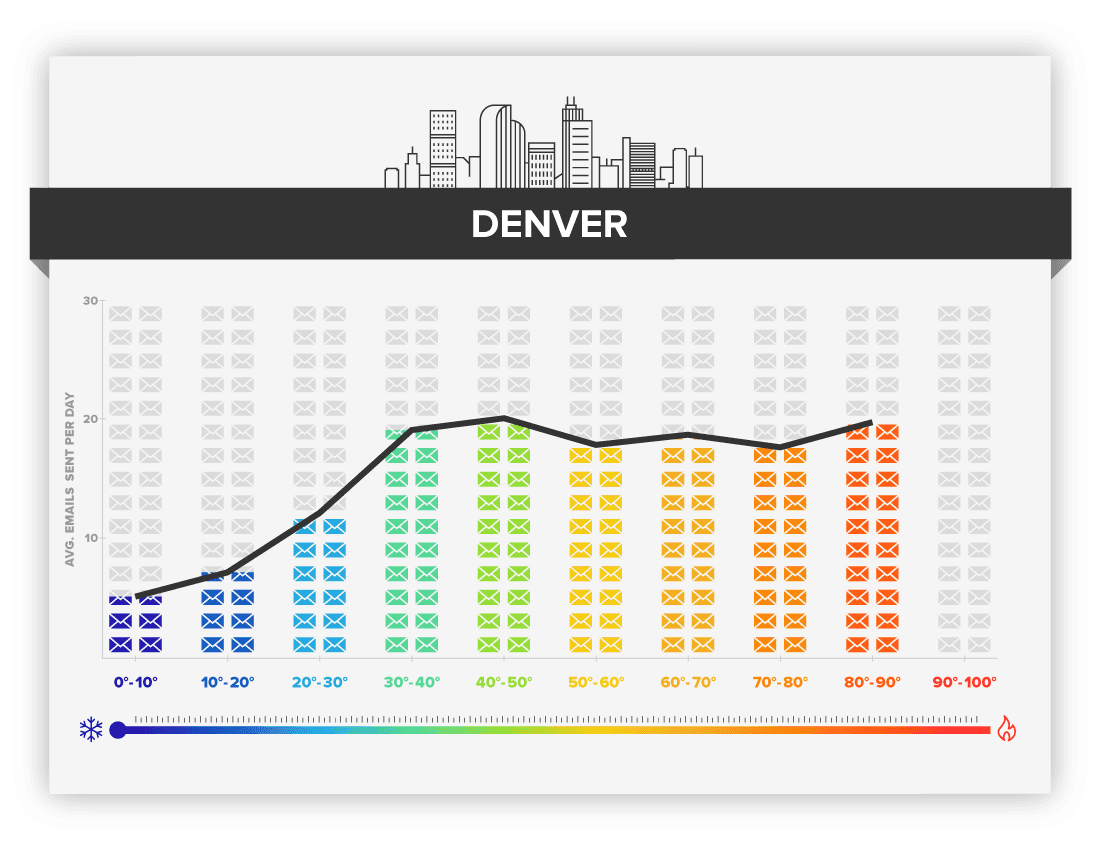
Here’s a breakdown of when each city sends fewer emails:
- Los Angeles: >60 degrees.
- New York: >40 degrees.
- Denver: >30 degrees.
- Phoenix: >60 degrees.
Lesson #2: Seattle and San Francisco send fewer emails in warmer temperatures.
When temperatures rise in Seattle and San Francisco, email productivity falls:
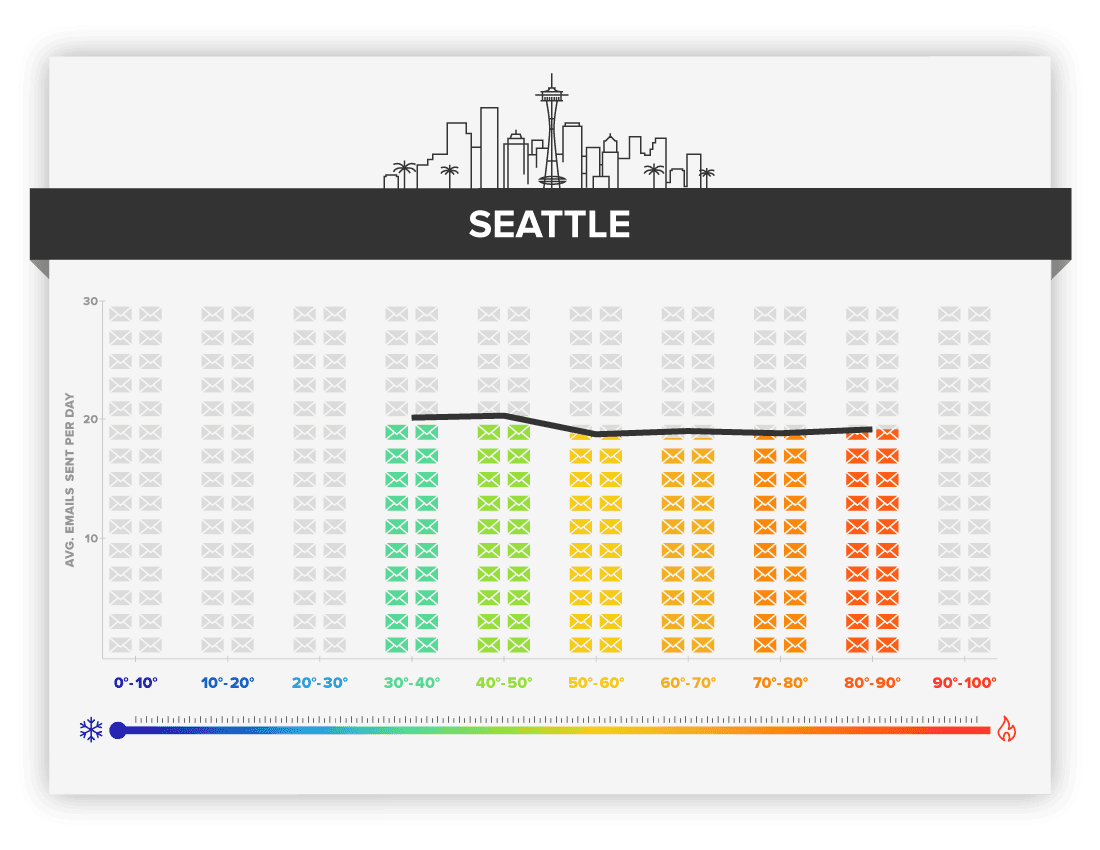
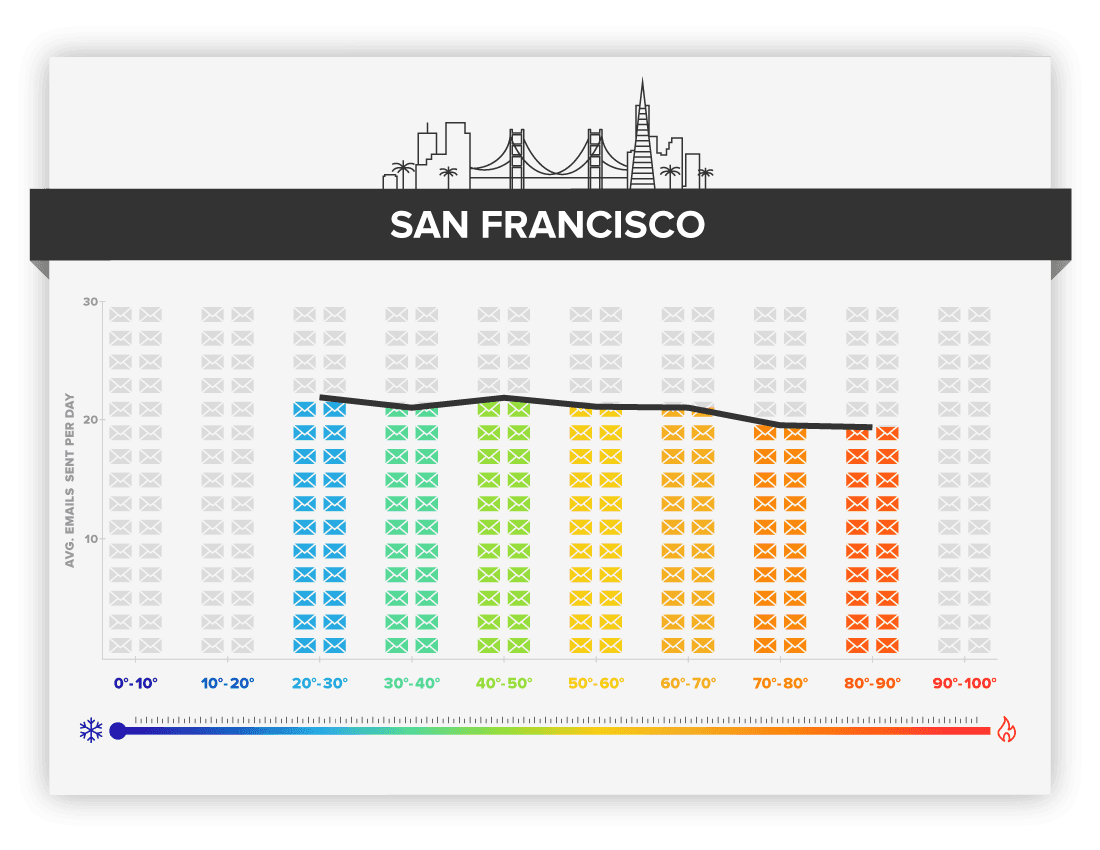
Takeaway: Our guess is that people in these cities know how to make the most out of a warm day — and that doesn’t include sending emails.
For example:
- Seattle is notoriously rainy and mild so when the temperature goes over 50 degrees, forget sending emails.
- When the temperature is over 70 degrees in San Francisco, only about 19 emails are sent out per day.
Lesson #3: Bostonians send more emails when it’s between 30 and 60 degrees out.
The good news: We found that Bostonians send the most emails when it’s between 30 and 60 degrees out:
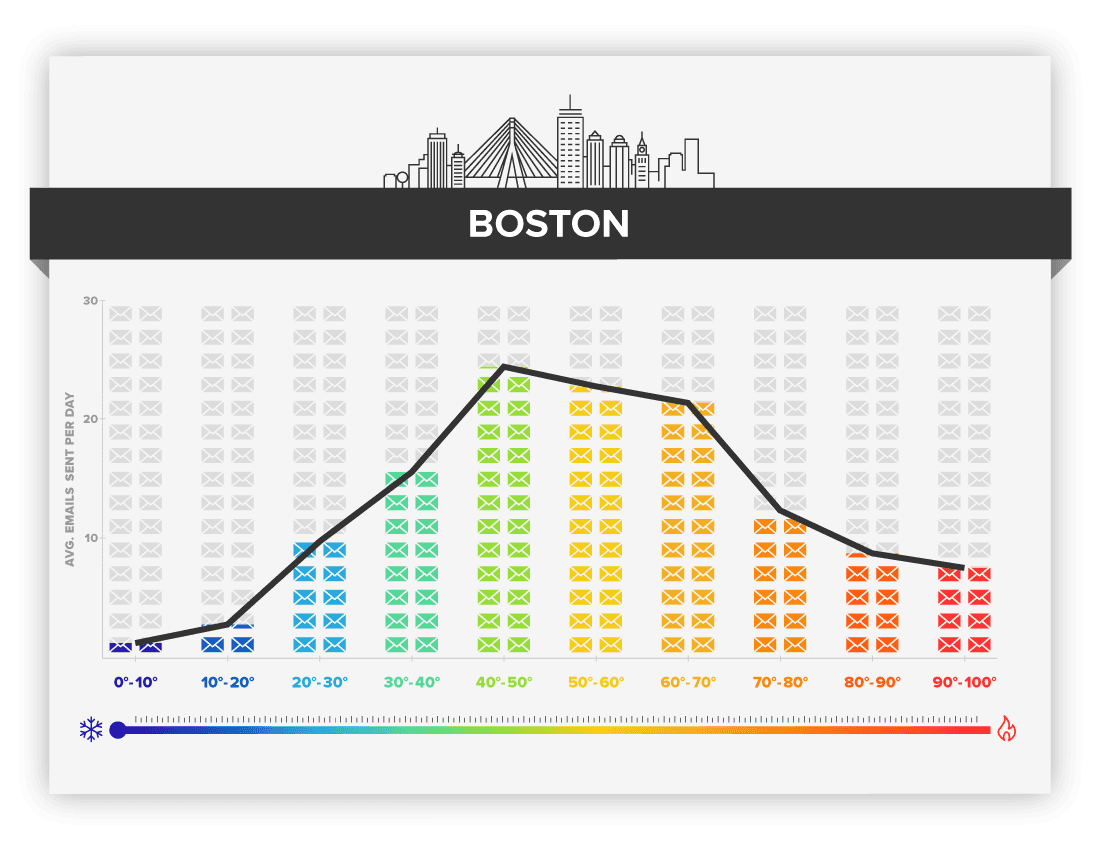
The bad news? The weather is so unpredictable in Boston there’s no telling when these temperatures might occur.
Takeaway: Less emails are sent during the frigid winter and those rare, hot, summer days.
Note: Our data analysis looked at the effects of varying weather conditions on our user’s email patterns for the top 10 US cities. For that purpose, our data science team studied how those email patterns changed when visualized in conjunction with factors such as rainfall patterns, temperature fluctuations, visibility and fog, etc. Our most significant findings fell within the categories of precipitation and temperature.
We studied Yesware users in the top 10 US cities (~40M emails) from April 2017 to February 2018. Note: This analysis looks simply at the event itself and does not involve tracking on any part of your email content.
All stated differences in the analysis were statistically significant at a 90% confidence level. Analyses were a mix of external and internal studies on rainfall patterns and the application of Tukey Procedures to identify differences between the groups studied.
Get sales tips and strategies delivered straight to your inbox.
Yesware will help you generate more sales right from your inbox. Try our Outlook add-on or Gmail Chrome extension for free, forever!
Related Articles

![Top Sales Follow-Up Statistics for 2024 [+ Templates]](/blog/_next/image/?url=https%3A%2F%2Fwww.yesware.com%2Fwp-content%2Fuploads%2F2021%2F04%2Fyesware-sales-follow-up-statistics.jpg&w=1280&q=75)

Jenny Keohane

Jenny Keohane

Jenny Keohane
Sales, deal management, and communication tips for your inbox