Sales Analytics: What You Should be Measuring


Casey O'Connor
Sales analytics are the set of tools and processes that a company uses to collect, synthesize, and draw actionable insights from the various sales data available to them.
Sales analytics plays an important role in sales forecasting and helping stakeholders with decision-making.
In this article, we’ll go over the best way to focus your efforts on your sales analytics strategy and processes.
Here’s what we’ll cover
- The Most Important Sales Analytics
- How to Analyze Your Sales Performance
- How to Use Analytics to Improve Sales
- Sales Analytics Tools to Measure Your Performance
The Most Important Sales Analytics
The technology available to salespeople today is becoming more and more powerful, fast, and reliable.
There’s no limit of choices when it comes to predictive analytics solutions available to help crunch the numbers (more on some of our top software choices later).
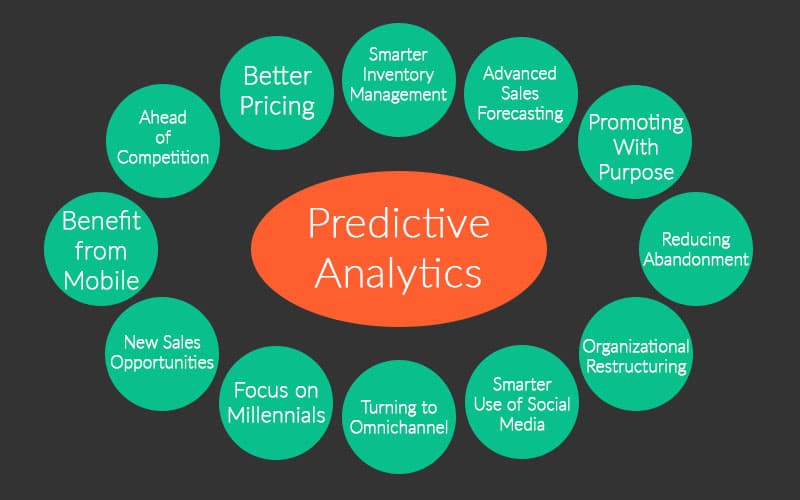
The real problem lies in the fact that, for most salespeople, there is literally too much data to digest. Sales analytics software is powerful enough to handle just about any data set you could dream up; the question is what kind of data is worth analyzing.
If you’re just starting to analyze your KPIs, or if you find yourself bogged down with too much historical data and you don’t even know where to start, use the following list of sales metrics as a jumping-off point.
They represent some of the most important and telling benchmarks for just about any business, product, or sales team. And will quickly help you better understand the health of your sales process.
Revenue
For most sales organizations, the bottom line is the name of the game. Everything sales reps do is for the sake of increasing sales growth and generating revenue.
Depending on your business structure, you may choose to zero in on basic revenue, year-over-year revenue growth, or annual recurring revenue.
Quota Attainment
For sales managers looking to identify specific reps who are in need of more training, sales quota attainment can be a very telling metric. Quota attainment data will show you, quite simply, which of your sales reps are meeting their quotas and which aren’t.
You can also reframe this data and analyze the percentage of your sales team hitting quota. This will indicate whether most of your team is pulling their weight, or if one or two high-flyers are responsible for most of your success.
Win Rate
Your win rate tells you how effectively your salesforce converts the sales opportunities available to them.
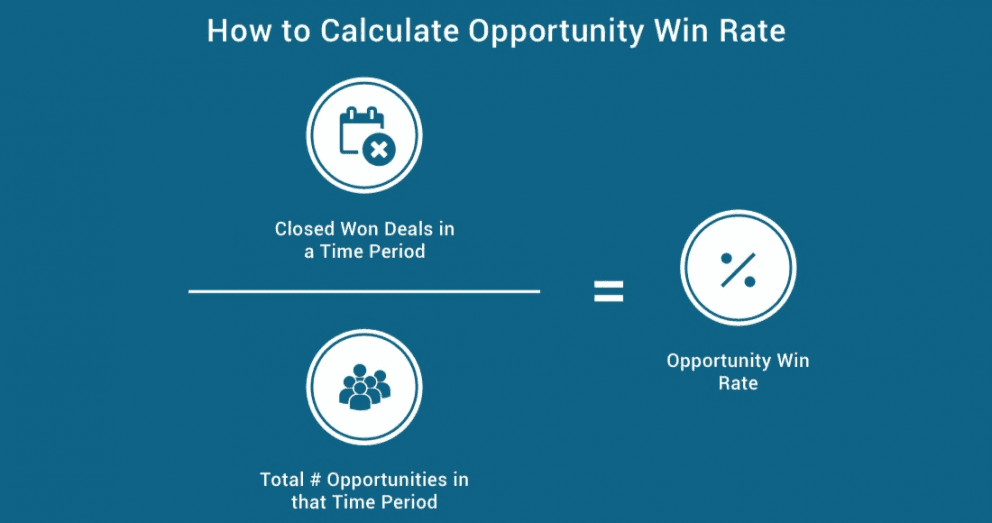
This metric is important for B2B sales teams because it’s one indicator of how effective they are at closing deals. Even the most robust sales pipeline can quickly become worthless if deals aren’t being closed.
Conversion Rate of Each Stage
While win rate can give you a snapshot of the overall health of your sales process, more actionable insight will come from analyzing the conversion rates of each stage of the sales pipeline:
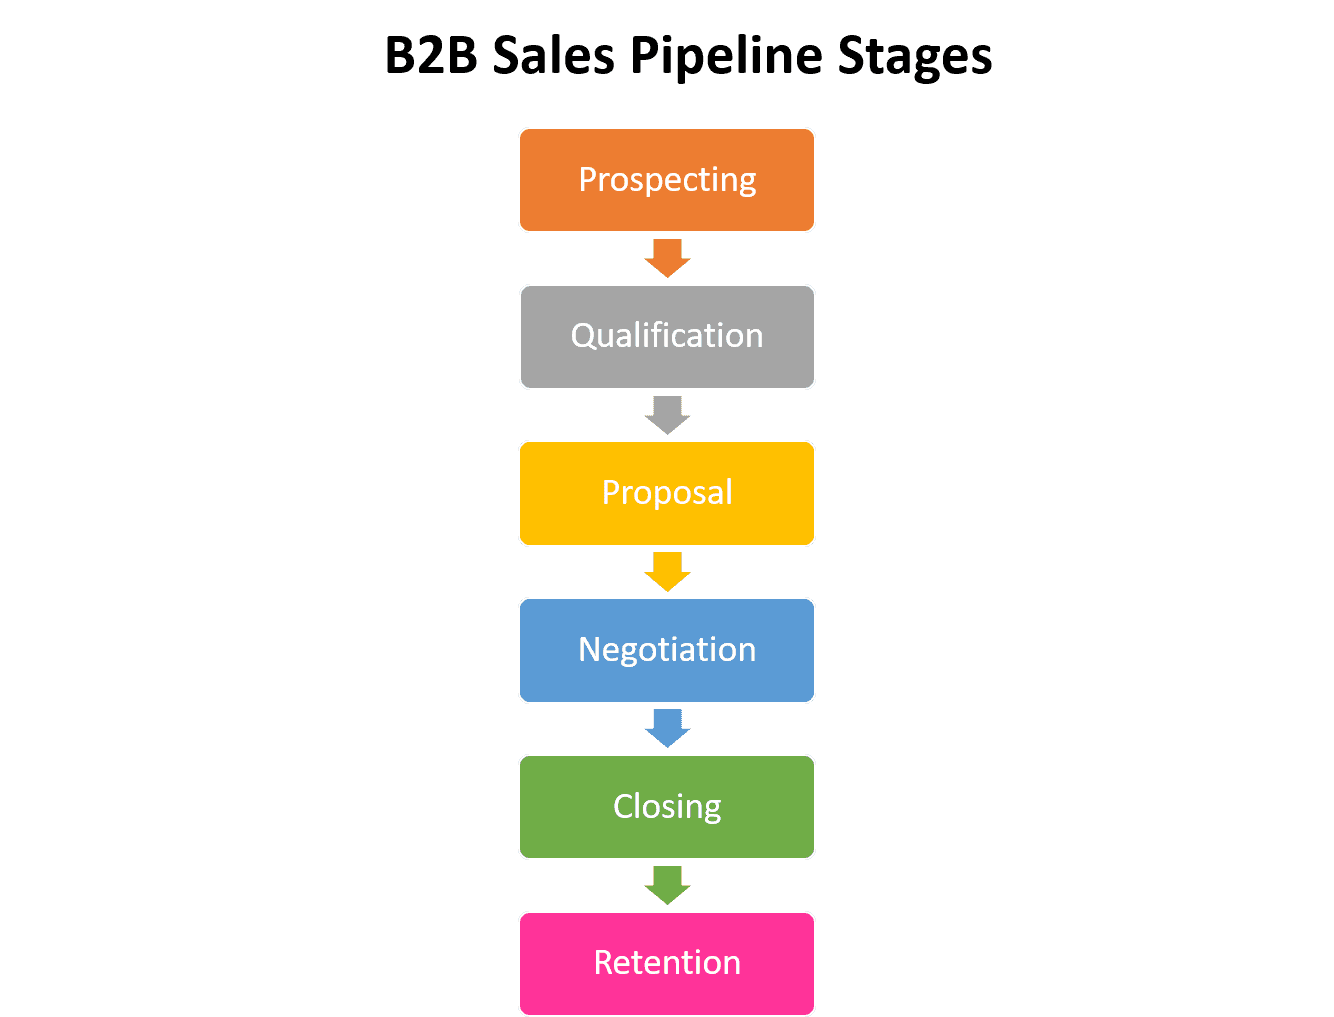
This kind of sales analysis will shed light on which stages of the process are most effective, and which are in need of a more targeted sales strategy and optimization.
This kind of step-by-step analysis of each stage is extremely valuable. It gives sales management a clear visualization of where their process can be most improved.
Sales Cycle Length
In almost all cases, a shorter sales cycle means better sales results. Of course, that’s not to say that a sales cycle of 10 days is universally better than one of 100 days — each business will have their own industry benchmark to hold as a standard.
For example, products with higher pricing typically take longer to sell, and enterprise clients are notorious for requiring ample time to make decisions.
The number of days alone isn’t necessarily indicative that time is being wasted. Instead, look at the length of your sales cycle against your own best performance, along with that of other competitive companies in your industry. If your team is falling outside of these ranges, you may want to start figuring out how to shave some time off the process.
Average Deal Size
To calculate your average deal size, you’ll want to divide your total revenue by the number of closed-won deals in a given time period.
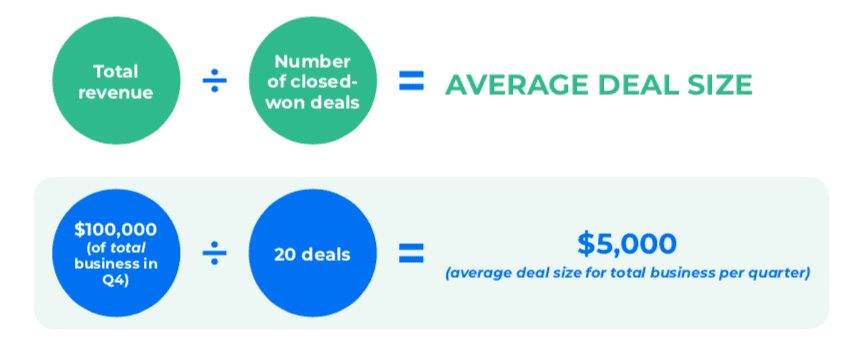
This may seem like a throwaway metric, but it can actually offer some valuable insight into product performance, and how impactful a sales team’s efforts are.
If, for example, your average deal size is lower than the cost of your middle-of-the-line offer, it might indicate that your sales reps are unfocused on (or untrained in) closing deals for higher-priced products.
Average Profit Margin
Speaking of higher prices, your profit margin is also a great indicator of how well your sales team’s efforts translate to the bottom line.
Higher-priced products typically have much higher profit margins. While they may take longer or be more difficult to sell, they have a much bigger impact on a company’s bottom line.
Churn Rate
Your churn rate represents how many customers you lose over a given time period.
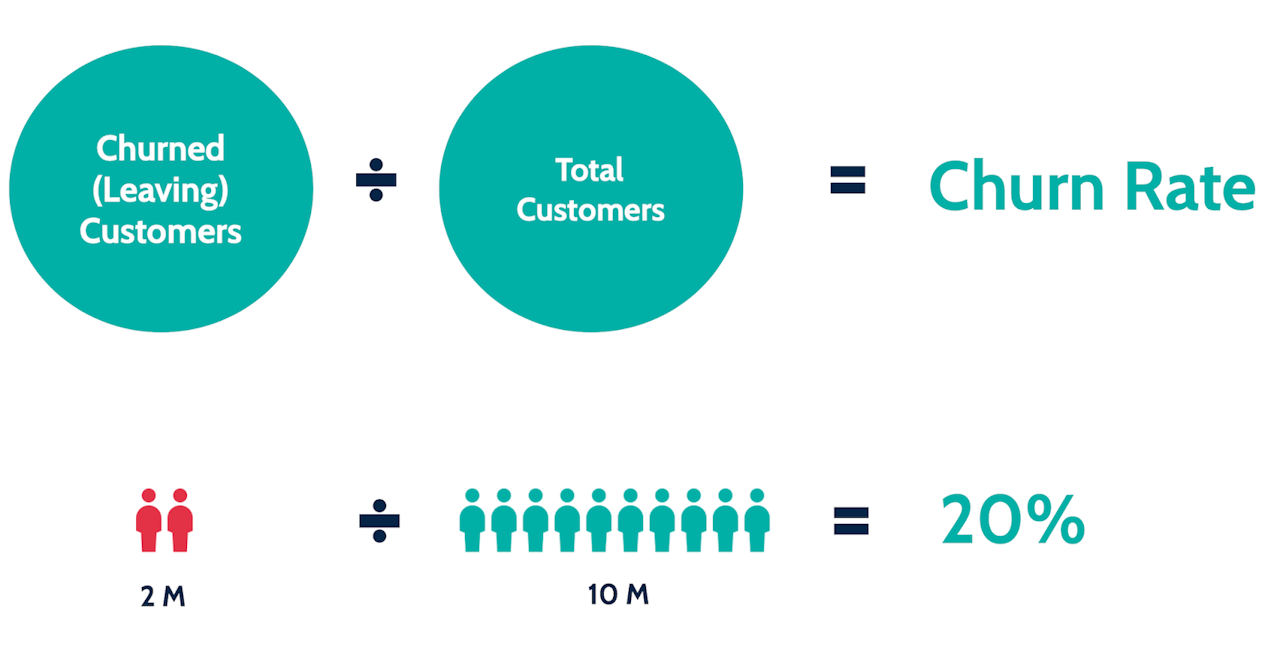 An excessively high churn rate means that your marketing and sales efforts are going to waste.
In other words, your sales organization is spending more time and money acquiring customers than the value those customers ultimately provide for the short time they’re signed on. A churn rate of 10% or above is usually an indicator that something within your customer experience needs to change.
Sales Productivity Metrics
Research has shown that salespeople only spend about 36% of their time on revenue-generating sales activities. The rest of their time is spent on administrative or other non-selling activities.
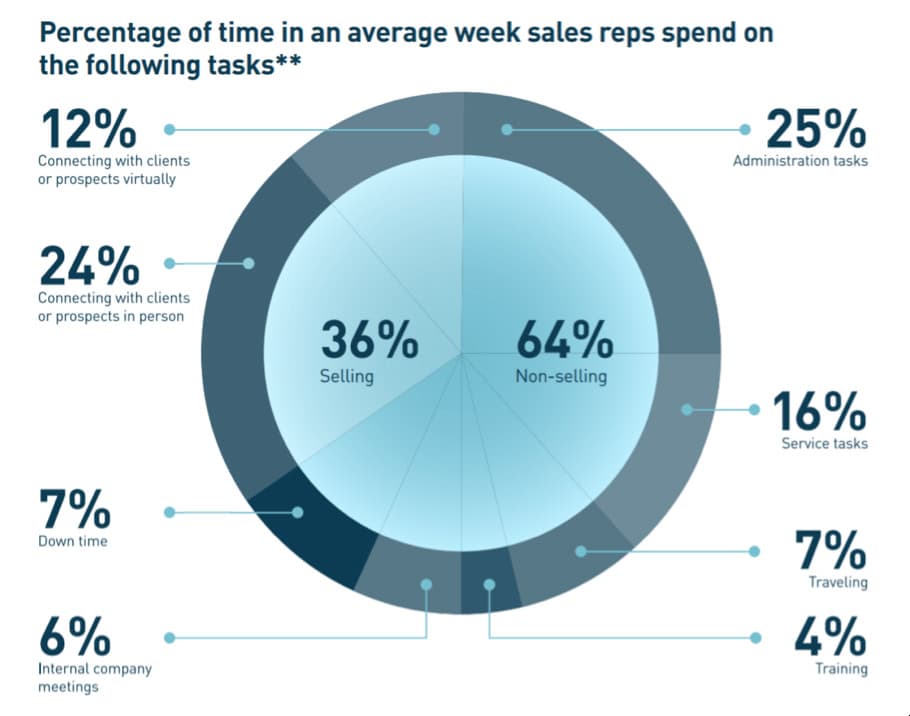
If you find that your salesforce has a workflow problem, it might be time to have a closer look at their sales productivity metrics.
A sales enablement team can help alleviate your sales team of some of their non-selling activities, so they can focus on the tasks that will be most beneficial to the bottom line.
Sales Funnel Leakage
Any sales analytics platform should be able to help you understand the weakest spots in your sales funnel.
Sales funnel leakage is one way to measure these stages and is basically a fancy way of labeling the opportunities lost at various stages of the cycle. Sales funnel leakage can occur for a variety of reasons.
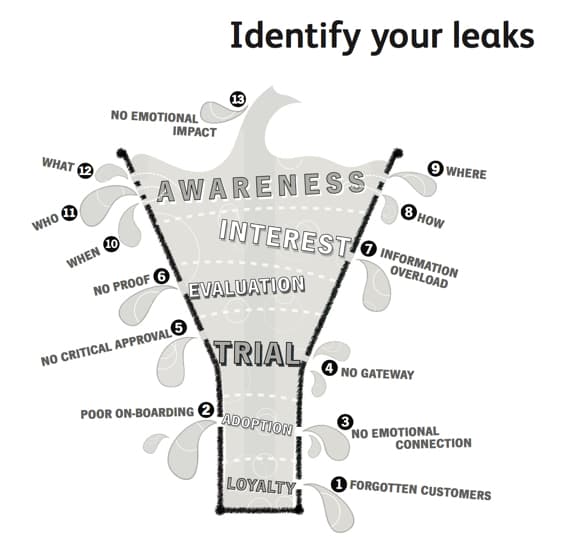
The truth is that every B2B sales funnel will always be a little leaky. Having no leaks would indicate a 100% win rate, which isn’t realistic. But measuring leakage across the funnel, and plugging leaks wherever you can, will add up over time.
Sales Growth
Measuring sales growth will help sales managers understand whether their team is actively and successfully pursuing new opportunities, or if they’re just sticking with the status quo.
Reliable sales growth is critical for creating accurate sales forecasts and remaining competitive over time.
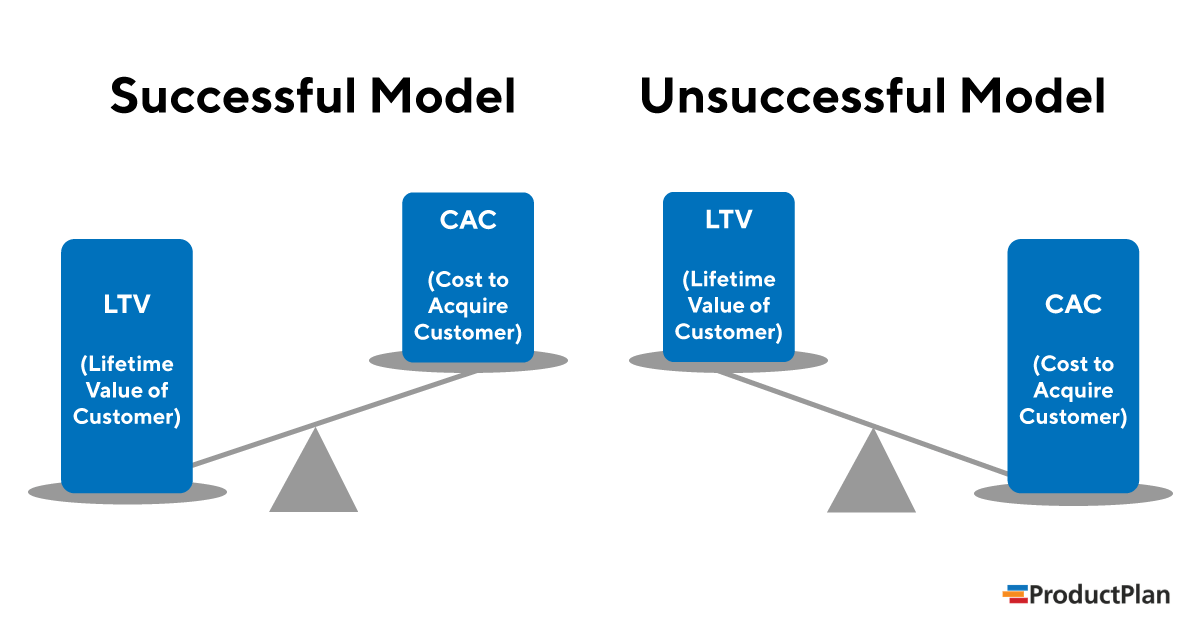
Customer Acquisition Cost
Customer acquisition cost (CAC) indicates how expensive it is to successfully move a prospect from top to bottom of the sales funnel. This is sometimes treated as a “background” metric, taking a backseat to more obvious ones like revenue or monthly growth.
But don’t sleep on this data: a CAC that’s too high can quickly throw your business model out of balance.
 All sales and marketing teams should make a point to keep their finger on the pulse of CAC.
How to Analyze Your Sales Performance
While it’s true that there is a virtually limitless number of software platforms that will help you automate the process, data analytics does still require some human thought and strategizing.
The following steps will help you fine-tune your analysis process and get the most out of whatever software you choose.
Step 1: Select Your Metric
The first step in any data analysis activity is to define what you’ll be analyzing. Too much data can quickly become counterproductive, so make sure your lens is clear and specific. If you’re not sure where to start, try analyzing one of the KPIs outlined above.
Step 2: Create Goals and Objectives
Despite what some salespeople might have otherwise experienced, data analysis is not just busywork. Data collection and analysis should have a purpose.
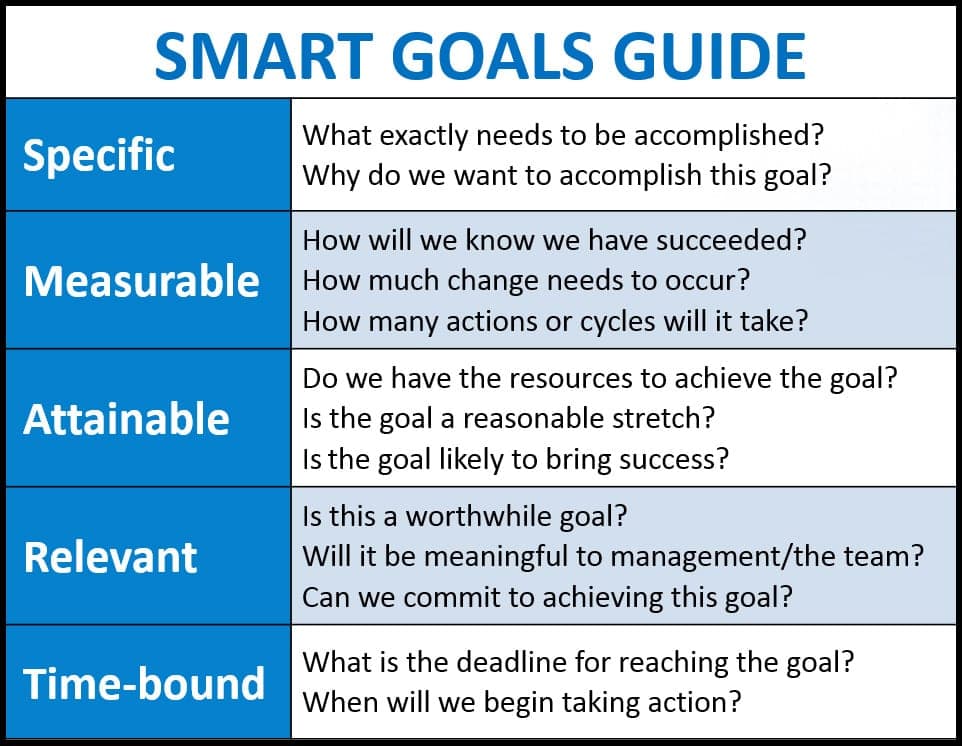
Once you’ve decided which metric(s) you’ll be studying, it’s time to set some goals. Consider following the SMART goal framework, which will help steer your thought process and put your data to work.
Don’t forget to indicate the time period and duration of your goal.
Step 4: Compile or Integrate Your Data
Most sales analytics platforms are capable of integrating seamlessly with your CRM, allowing your data to be aggregated and accessed in one streamlined location. Be sure to work with your sales team to ensure they’re up-to-speed on the capabilities of your specific platform.
Even if you don’t yet have software at your disposal, your expectations for data entry should be clear. The best sales analytics are updated in real-time and should be accessible by everyone on the team. A shared Excel sheet is a great place to start while you find the software that best suits your team’s needs.
Step 5: Use a Dashboard
A sales dashboard is a visual representation of sales data.
Here’s an example:
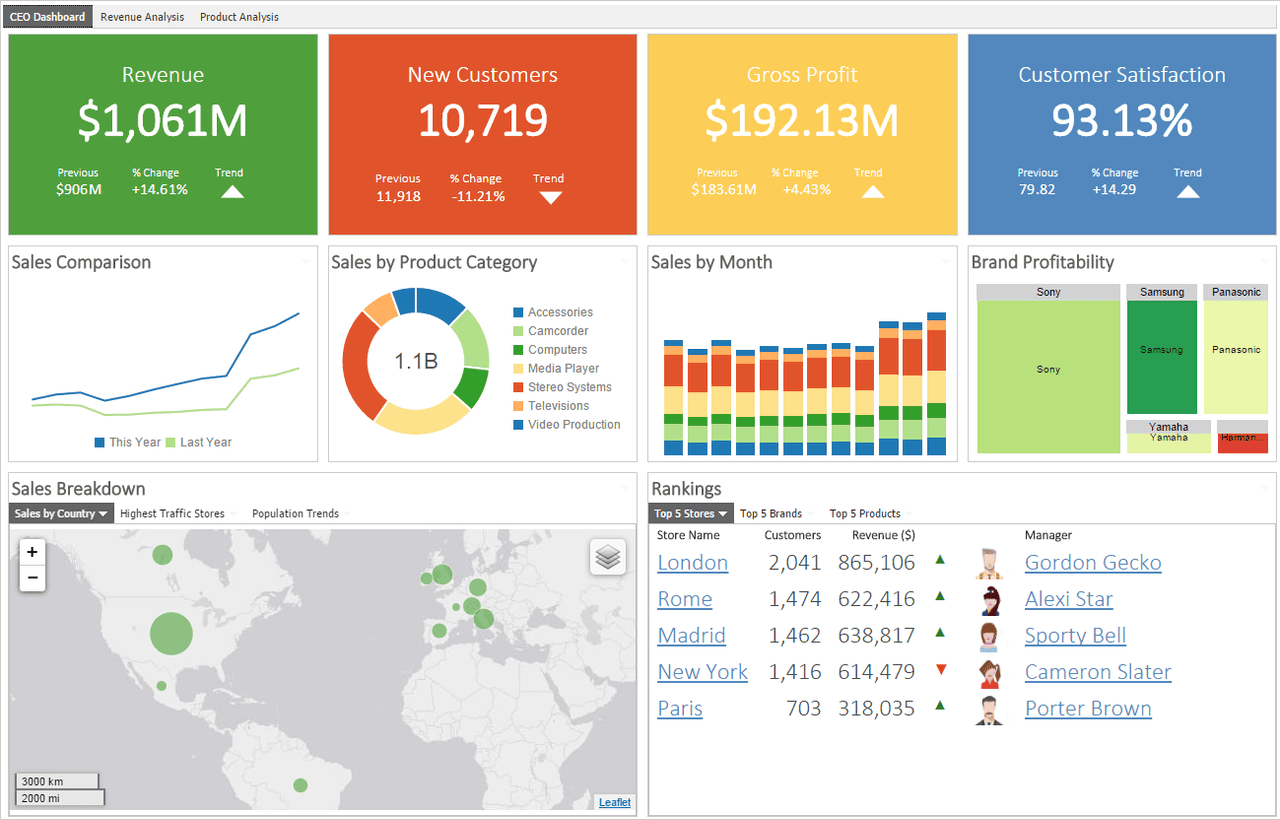
Most sales dashboards are capable of integrating with CRMs and other analytics platforms. They’re typically very easy to use, and offer a powerful way to visualize otherwise dry and difficult-to-interpret data.
Step 6: Analyze Data & Make Decisions
The real purpose of data analysis is to improve decision-making. Although the process relies on historical data, or things that have already happened, it serves the purpose of a forward-looking activity.
Use your sales dashboard or other analysis tools to draw conclusions about your sales strategy, process, and results to improve your future performance.
 Sales Engagement Data Trends for Sales Managers to Know Going Into 2022Looking at hundreds of millions of tracked email activity over the past year, this ebook is filled with our top studies & findings to help your sales team accelerate results in 2022.
How to Use Analytics to Improve Sales
By now, it’s clear that sales data analysis is a powerful tool for any sales team hoping to improve their performance. Here are just a small handful of ways that sales analytics can help your team increase their sales.
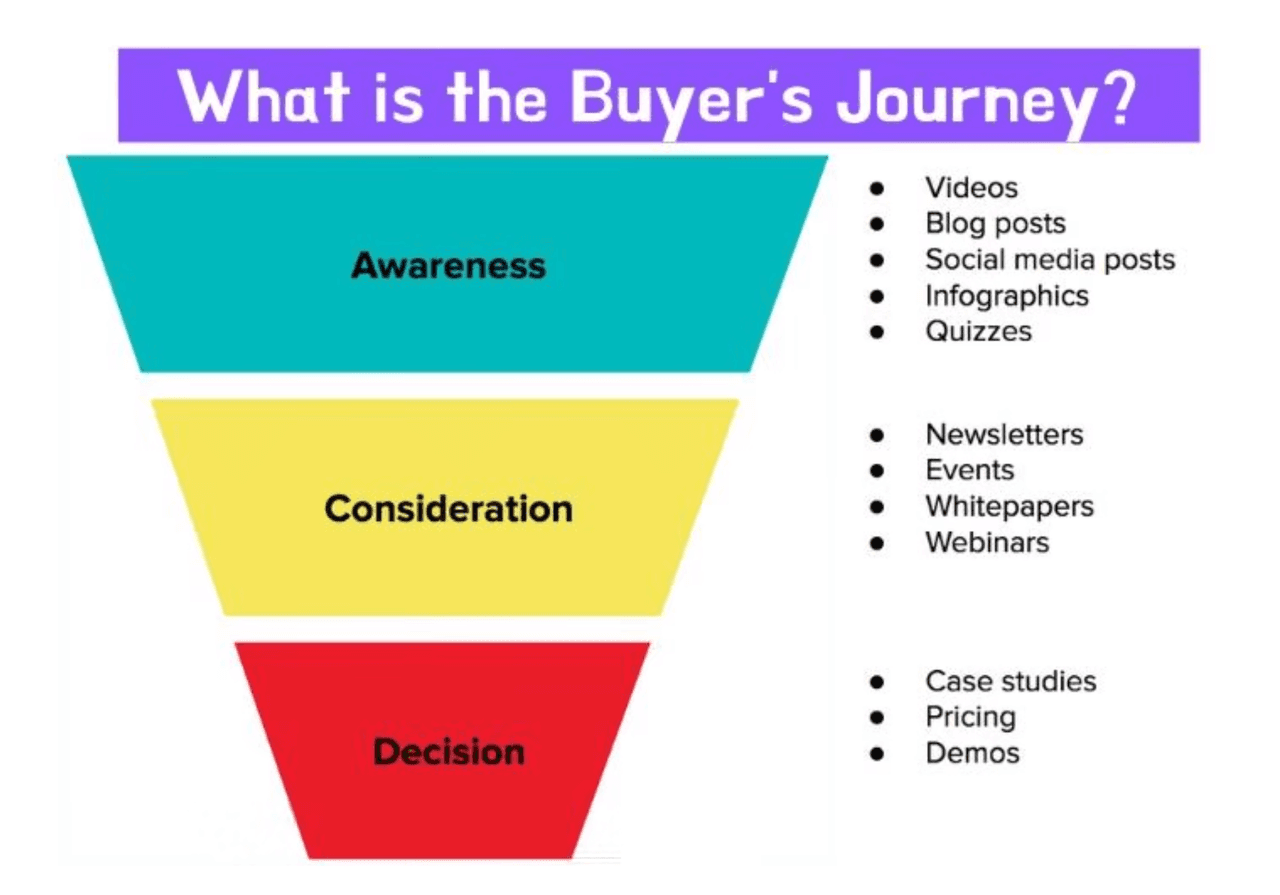
- Predict Customer Behavior: The more you understand about the buyer’s journey, the better you can optimize your pipeline to suit their needs. Sales analytics can help you understand what kind of content or sales strategy resonates best with your target customer.
- Optimize Product Pricing: Metrics like profit margin and average deal size can shed light on whether or not your product pricing is appropriate for your business goals. If the numbers aren’t quite adding up, it might be time to revisit your pricing plan.
- Fine-tune the Funnel: Each stage of the sales funnel should be analyzed both in isolation and as a component of the whole. This can help you pinpoint specific areas of growth, which many sales managers find to be quick fixes and an attractive alternative to scrapping the entire pipeline and starting from scratch.
- Boost Productivity: Sales productivity metrics can give great insight about whether or not your sales reps are able to offer peak performance. The intention here isn’t to micromanage your reps’ time and activities; most sales reps are trying to be productive, but are simply overloaded by the number of tasks they’re expected to perform.
Instead, use productivity data to determine which tasks are making the biggest difference to the bottom line, and which should be outsourced or automated.
Your sales analytics platform will also likely offer its own insights on how to best use the data to move your team forward.
Sales Analytics Tools to Measure Your Performance
As discussed, the options available for data analysis are nearly endless. Here are a few of our favorite, most powerful tools for collecting and synthesizing data for your team.
MaxG
MaxG also has powerful analytics capabilities, particularly in its predictive analysis features. It can take historical sales data and translate it into forward-looking trend predictions. MaxG also offers an industry benchmarking feature, which is a useful tool in measuring how your team stacks up against its competitors.
Yesware
Yesware’s all-in-one sales toolkit includes powerful and streamlined reporting and analytics features. It enables teams to identify winning content and repeatable processes and provides visibility into the entire sales process.
Dear Lucy
Dear Lucy is known for being extremely easy to get up and running, making it a great option for teams that are just getting started with predictive analytics. It’s not just for beginners, though — Dear Lucy is perfectly capable of handling even non-basic data sets and can grow with your team as you generate more and more data.
Zoho Analytics
Zoho is known in the sales world for its beautiful, visually appealing dashboards. It’s also extremely powerful — it can collect, blend, and beautify data from a huge number of sources.
Get sales tips and strategies delivered straight to your inbox.
Yesware will help you generate more sales right from your inbox. Try our Outlook add-on or Gmail Chrome extension for free, forever!
Related Articles


Anya Vitko

Casey O'Connor

Casey O'Connor
Sales, deal management, and communication tips for your inbox