18 Sales KPIs All Successful Sales Teams Should Be Tracking


Sales KPIs help sales reps and sales managers measure how close the organization is to meeting its goals.
They are an evaluative type of sales metric and help sales professionals make informed, data-driven decisions about how to move the business forward.
It’s important for individual sales reps and their teams, collectively, to be familiar with, analyze, and draw insight from their most important KPIs.
In this article, we’ll go over everything you need to know about sales KPIs, including what they are (and how they differ from sales metrics), why they’re so important, and the most crucial ones for any business to start tracking today.
Here’s what we’ll cover:
- What Are Sales KPIs?
- Why Are Sales KPIs So Important?
- How to Choose the Right KPIs
- Sales KPIs vs. Sales Metrics
- 18 Sales KPIs You Should Be Tracking
- Best Practices for Tracking Sales KPIs
- How to Leverage Sales KPI Dashboards
What Are Sales KPIs?
Sales KPIs are a specific type of sales metric. They are used to measure the progress of an individual sales rep, a sales team, or an entire organization against their outlined performance goals.
Sales KPIs are evaluative; they can be used as one indicator of an organization’s level of success.
They also help sales leaders and C-suite executives make informed decisions, based on hard data, about how to strategically advance the business.

Why Are Sales KPIs So Important?
Tracking sales KPIs is crucial for any sales team that wants to optimize their sales efforts and generate more revenue. In general, sales KPIs are used to track, analyze, and improve sales performance on an individual and team-wide level.
Careful monitoring of sales KPIs also has specific benefits for sales managers, sales reps, and customers.
Helps Sales Managers
Nearly half of today’s sales managers report that their biggest sales challenge is that deals take too long to close.
Careful analysis of sales KPIs can help sales managers and other organization leaders determine which sales activities are effectively moving the pipeline, and which are creating bottlenecks.
They help sales managers track sales trends and patterns that can help them develop successful, scalable sales strategies.
They also help sales leaders create more accurate sales forecasts.
Helps Sales Reps
Sales KPIs help sales reps in many of the same ways that they do sales managers.
These metrics break down the sales process into individual, self-contained (and measurable) activities so that sales reps can prioritize their time accordingly and pinpoint and strengthen their areas of growth.
Helps Customers
Effective sales KPI management and analysis improves communication across all channels. It helps ensure that sales reps are following up in a more timely and relevant manner.
In turn, customer satisfaction and employee engagement also increase.
It’s important to note that, while sales KPIs undoubtedly play an important role in generating success for a sales team, tracking the right ones is what makes the difference between good and great sales teams.
Those “right” ones, of course, will depend heavily on the specifics of your team’s strengths, areas of growth, and targets and goals.
Sales KPIs vs. Sales Metrics
The terms “sales KPIs” and “sales metrics” are often used interchangeably, but there are actually some subtle differences between the two.

In short, sales metrics are the data that are automatically created when salespeople perform sales activities. Sales KPIs are specific sales metrics that are analyzed, in context, to determine how well an organization is progressing toward meeting its goals.
How to Choose the Right KPIs
Choosing the right KPIs to track is just as important as tracking them in the first place.
There are dozens of sales KPIs that have the potential to guide salespeople’s decision-making. The specific ones your team chooses to track will ultimately depend on the unique goals your team sets.
Regardless, all sales teams need to be mindful of tracking both core/foundational KPIs (e.g., number of closed deals, new leads in the pipeline, quota attainment) and ones that measure customer value/longevity and employee effectiveness.
Below are some of the most common KPIs for sales teams to track.
18 Sales KPIs You Should Be Tracking
The way people “do sales” is changing faster than ever in today’s digital world.
With more and more buyers conducting the majority of the buyer’s journey independently — many completing up to 70% of their research before ever contacting a sales rep — it can be difficult for organizations to keep a pulse on the metrics that matter.
Following are 18 sales KPIs that will shed light on performance and help virtually any sales team scale and grow their success.
1. Average Customer Lifetime Value (LTV)
Average customer lifetime value represents the average total revenue that a customer generates throughout its contract with your business.
Here’s the formula for calculating average customer lifetime value:
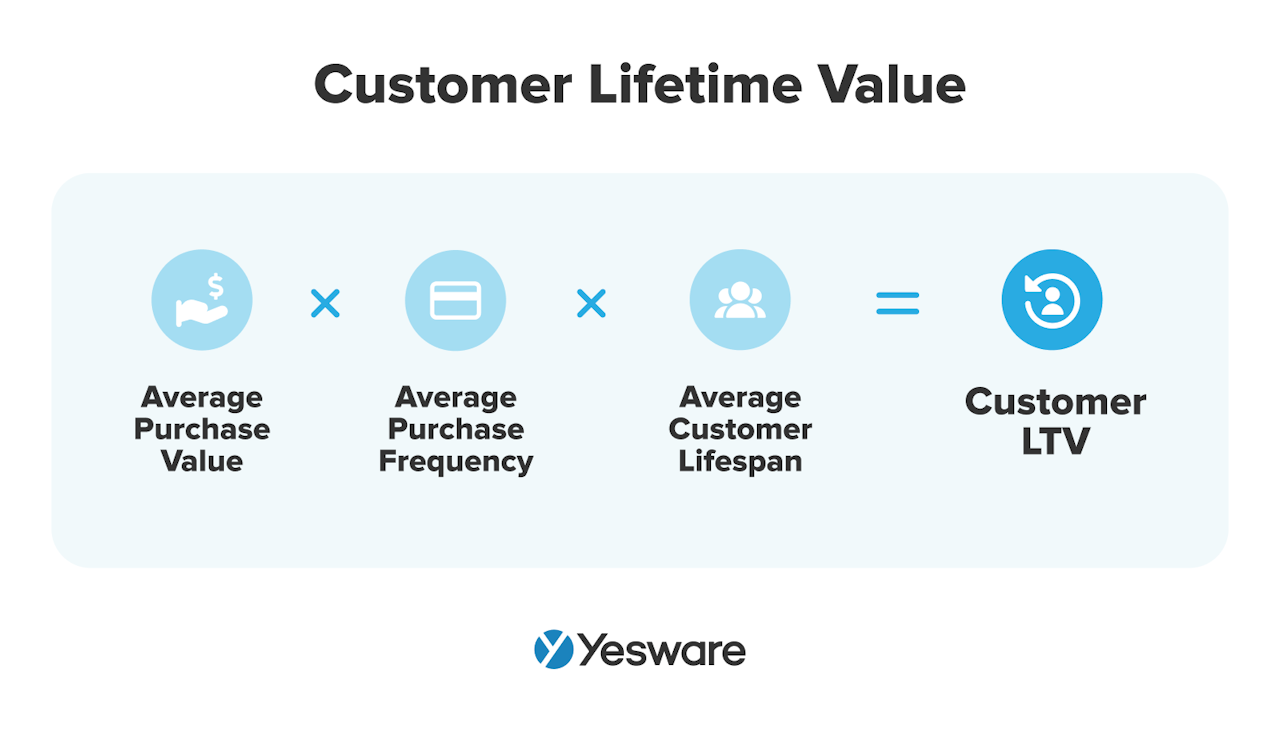
Average customer LTV is useful in determining which customer segments are most lucrative to your business.
2. Market Penetration Rate
Market penetration rate refers to how much of the total addressable market your company currently serves.
Here is the simple formula for calculating market penetration rate:
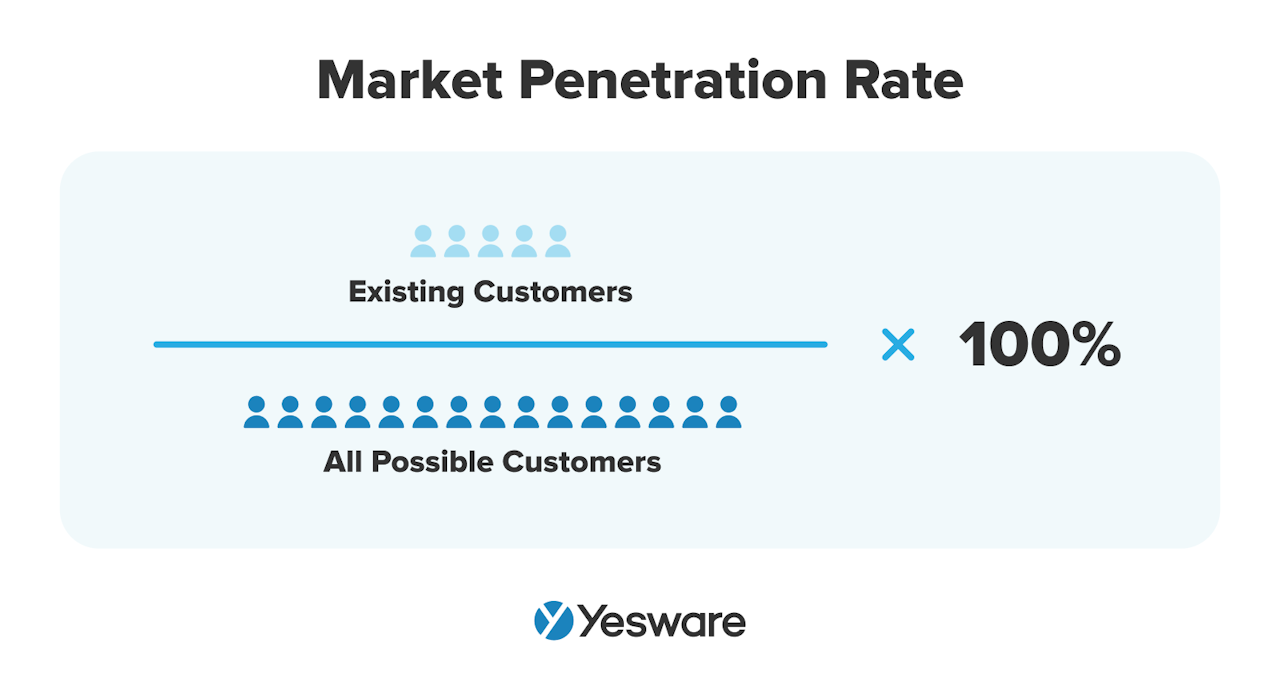
A low market penetration rate might indicate a need to revisit your ideal customer profile (ICP) and/or how effectively your specific sales strategies reach your target market.
3. Opportunity Win Rate
Opportunity win rate is a sales metric that’s a bit more specific than conversion rate.
It will also be a KPI that’s extremely specific to your team — this metric will be shaped by the unique way in which your organization defines a “sales opportunity.”
The opportunity win rate measures how many opportunities you or your team won, relative to the number of opportunities created.
Here’s the formula:
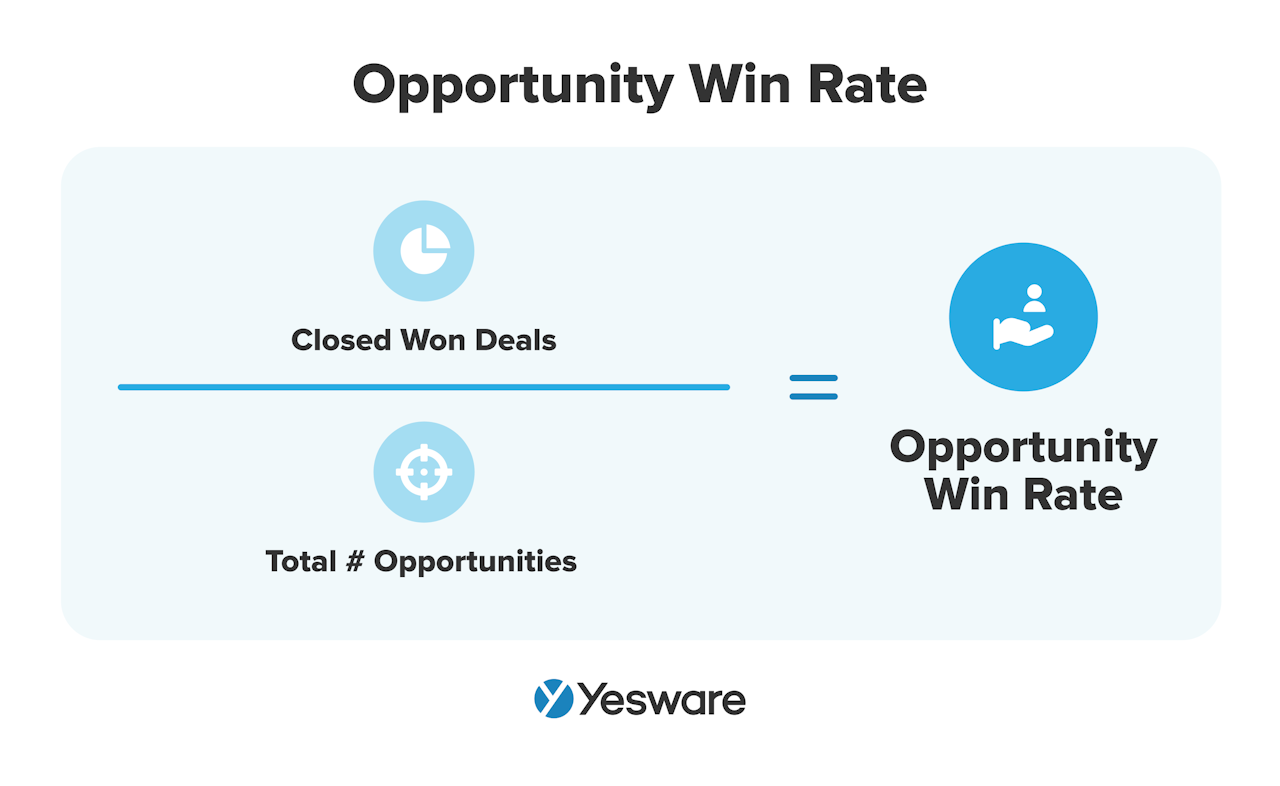
This sales KPI is also sometimes known as a rolling close rate.
4. Pipeline Coverage
Pipeline coverage refers to the value of a sales rep’s or sales team’s potential sales opportunities as it compares to their quota within a specific time frame. This sales metric is expressed as a multiple of the quota.
Here’s the formula for calculating pipeline coverage:
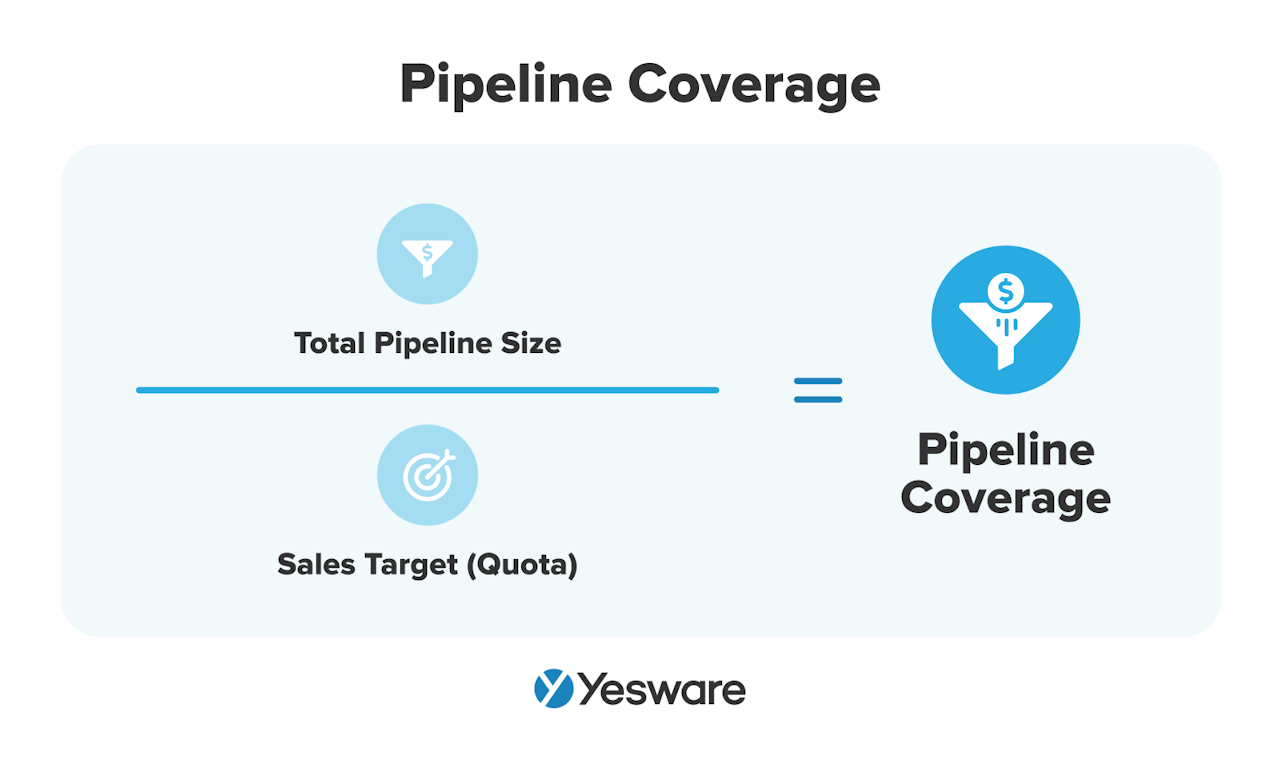
This KPI helps sales professionals adjust their approach as they work (rather than looking back at their performance reflectively) so they can come closer to meeting their quota.
5. Quota Attainment
This one’s pretty straightforward.
Quota attainment measures how close a sales rep or sales team comes to meeting their sales goals. It’s usually measured per month, per quarter, or per year.
Here’s the formula for calculating sales quota attainment:
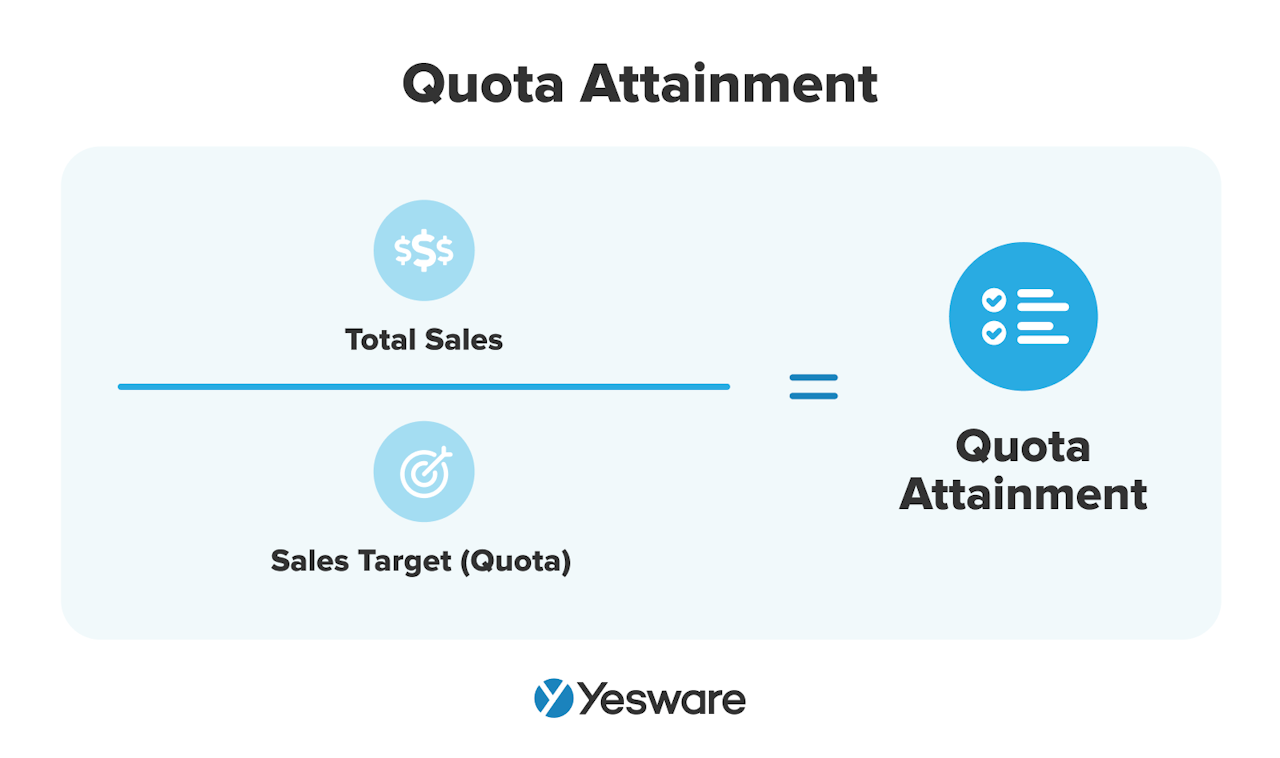
Quota attainment helps sales leaders create and adjust sales forecasts, identify strengths and weaknesses in the pipeline, and optimize their sales strategies.
6. Average Sales Cycle Length
Average sales cycle length refers to the amount of time it takes for an unqualified lead to become a customer.
The shorter the sales cycle, the better — closing more deals in less time means more revenue.
Here’s the formula for calculating sales cycle length:
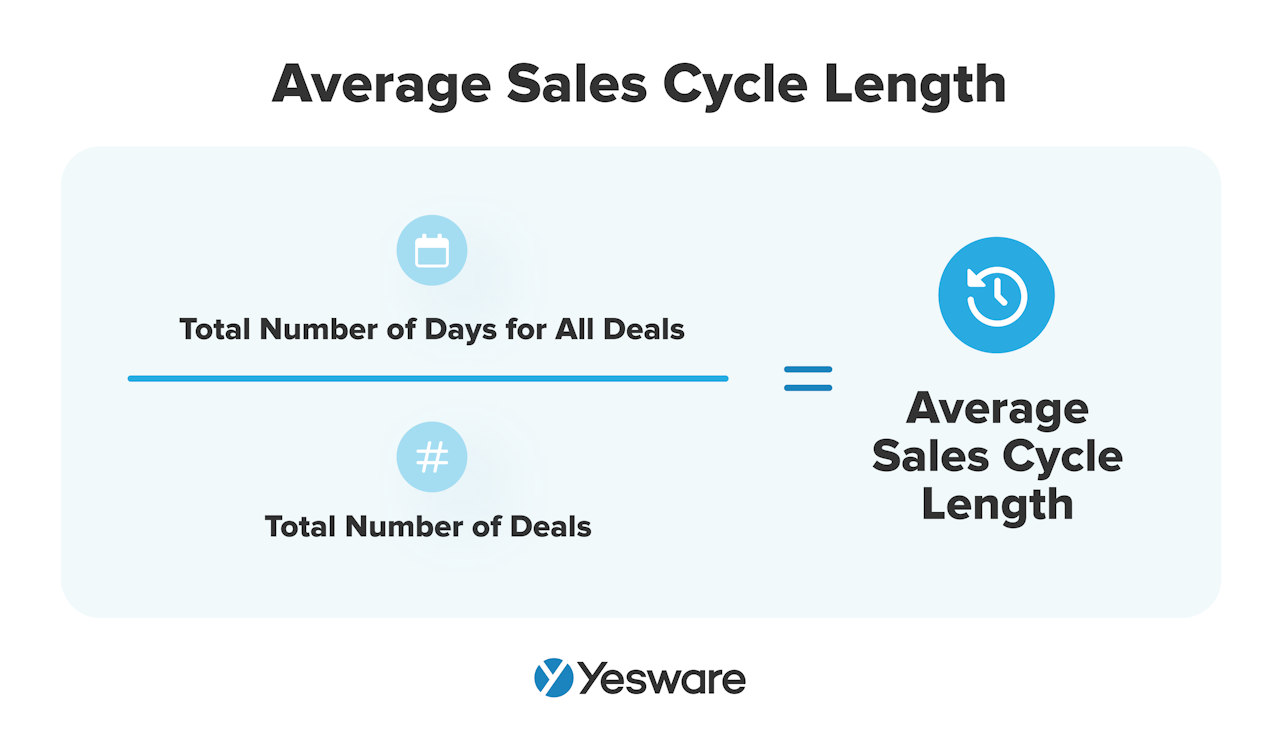
Keep in mind that shortening the sales cycle just for the sake of making it shorter doesn’t necessarily drive results. Some sales cycles are naturally longer than others, and that’s okay. The important part is that your sales cycle doesn’t take any longer than necessary.
7. Customer Acquisition Cost (CAC)
In its simplest terms, the customer acquisition cost is calculated by adding up all of the money spent on acquiring a new customer and dividing it by the number of new customers.
Here’s the formula:
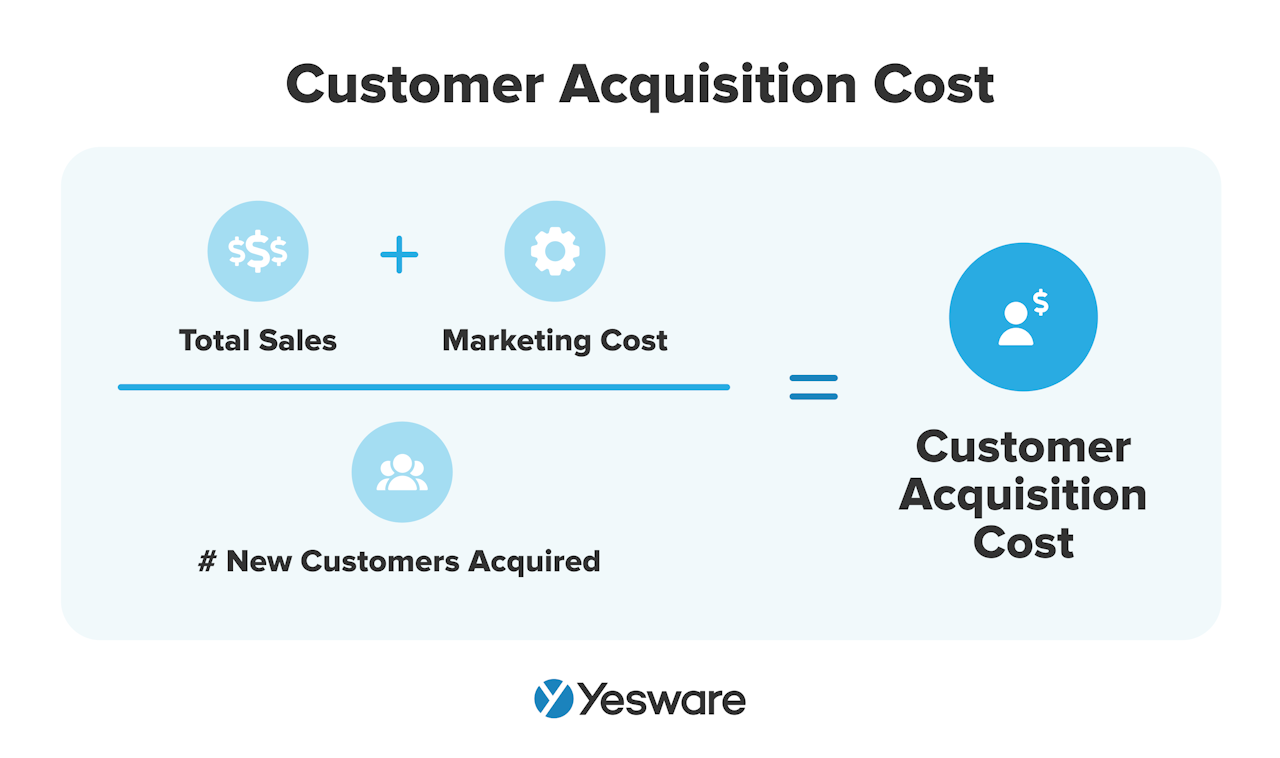
Customer acquisition cost is another KPI that can vary widely by team. It’s also important to note that your team may have other costs involved in acquiring customers. Make sure you’re paying careful attention to financial outputs to get the most out of this KPI.
8. MRR
Monthly recurring revenue (MRR) is an important KPI for SaaS companies. It measures how much money an organization makes per month from its recurring monthly subscription plans.
Here’s the basic formula:
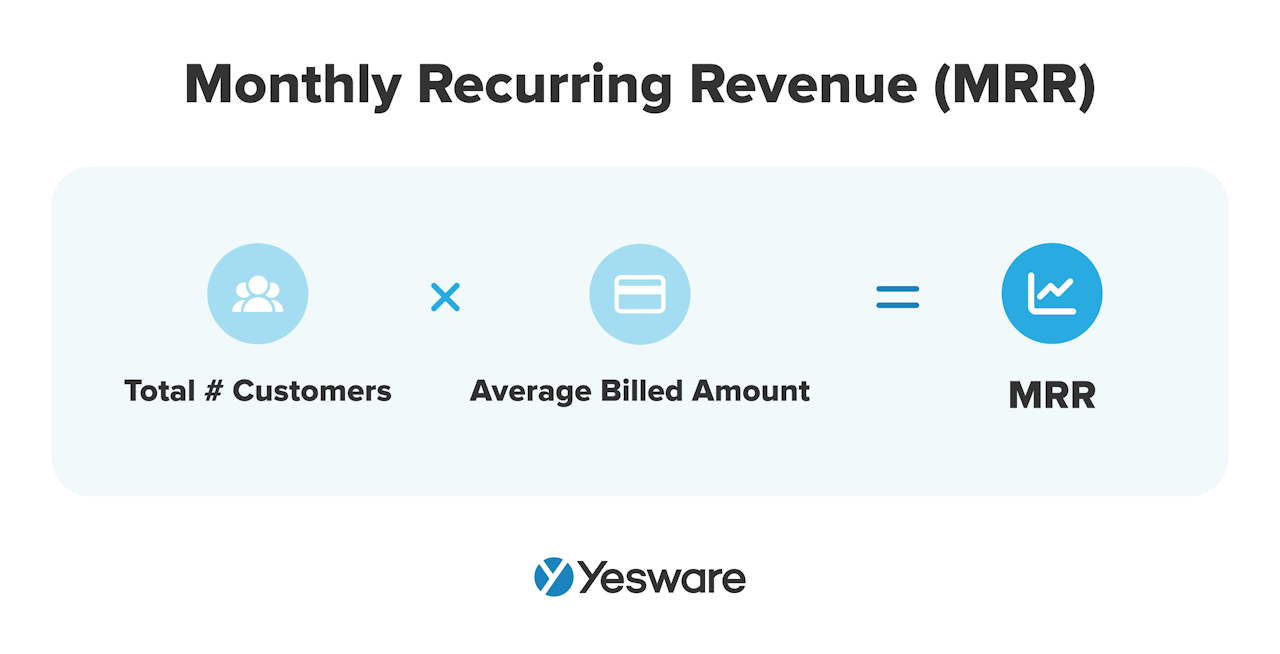
Again, this is a metric that will vary by team and product. There are also several sub-metrics when it comes to MRR, and the ones that have the most impact will vary by team.
MRR growth rate, for example, measures the increase or decrease of revenue month-to-month.
New and expansion MRR rate measures how much MRR comes from new customers or existing customers that have increased their contract value.
9. Average Response Time
Average response time is another straightforward sales KPI. It refers to the average amount of time it takes your sales reps to respond to a lead.
To calculate average response time, tally the total amount of time it took your team to respond to all leads, and then divide it by the total number of responses.
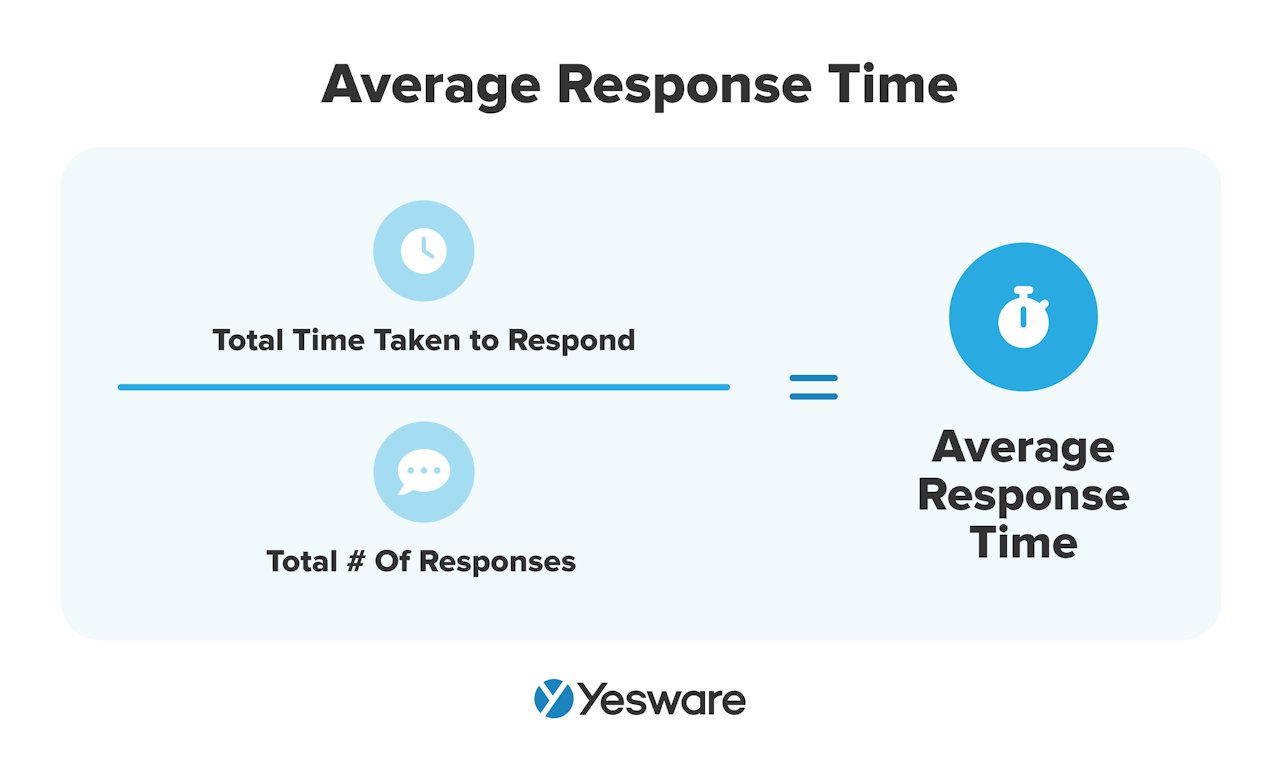
Average response time is extremely important — research shows that the first sales rep to respond to a lead wins 35 – 50% of sales.
10. Customer Retention Rate
Customer retention rate refers to the rate of customers an organization manages to retain on a monthly basis.
To calculate this metric, start by counting the total number of customers you have onboard at the end of a given time period. Then, subtract the number of new customers you signed on during that period.
Finally, divide the difference by the number of customers you had at the start of the period.
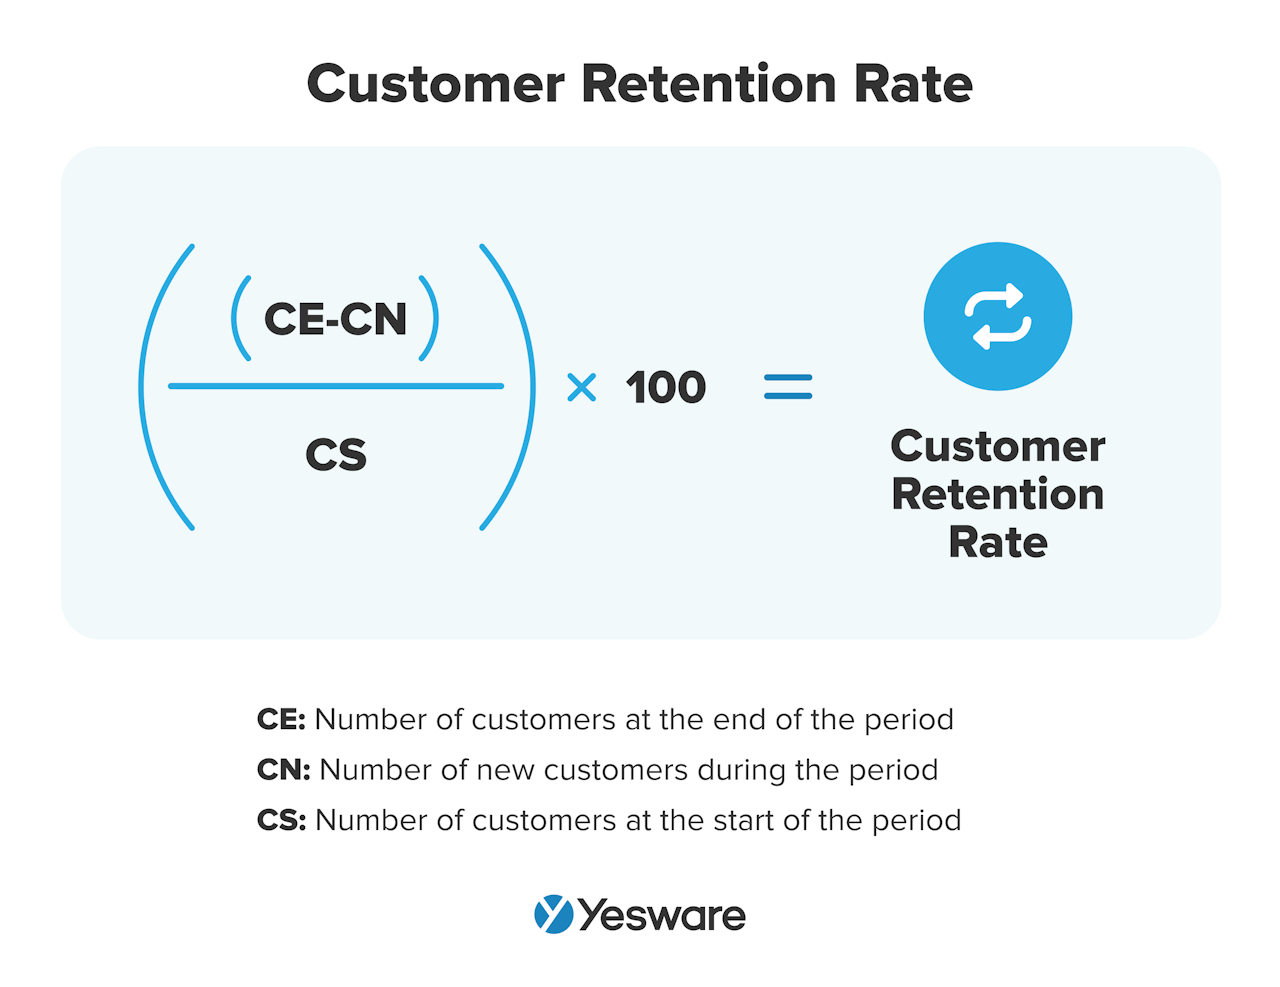 Customer retention rate can give sales leaders a good snapshot into customer satisfaction levels. This is obviously important for the longevity of a business, but can also give insight into the effectiveness of the top half of your funnel. High customer retention rates usually mean your team generates leads from and presents well to your target market.
11. Sales Volume by Location
Measuring the sales volume by location can give you so much more insight than simply which region spends more money on your product.
There are often underlying variables and differences between each location that will help sales leaders pinpoint the most effective selling strategies.
There’s no specific “formula” for calculating sales volume by region. The more important determination for this metric is how distinctly your team defines regional boundaries. Once your territories are firmly set, simply compare the sales volume for each location.
12. Competitor Pricing
While competitor pricing isn’t technically a sales KPI, it is relevant to the overall KPI conversation.
Analyzing competitor pricing helps sales leaders gauge the possible effects of lowering or raising the price, offering discounts or promotions, or otherwise adapting sales strategies in a competitive market.
13. Existing Client Engagement
Many sales teams do a great job of analyzing their sales pipeline KPIs but neglect the post-pipeline period.
When this happens, one important metric that gets overlooked is the engagement level of your current clients.
It’s generally accepted that the customer engagement score (CES) can be calculated by simply assigning values to different inputs or events (e.g., upgrading a plan, opening a newsletter, sending a customer support ticket, etc.) and adding those inputs up for each customer.
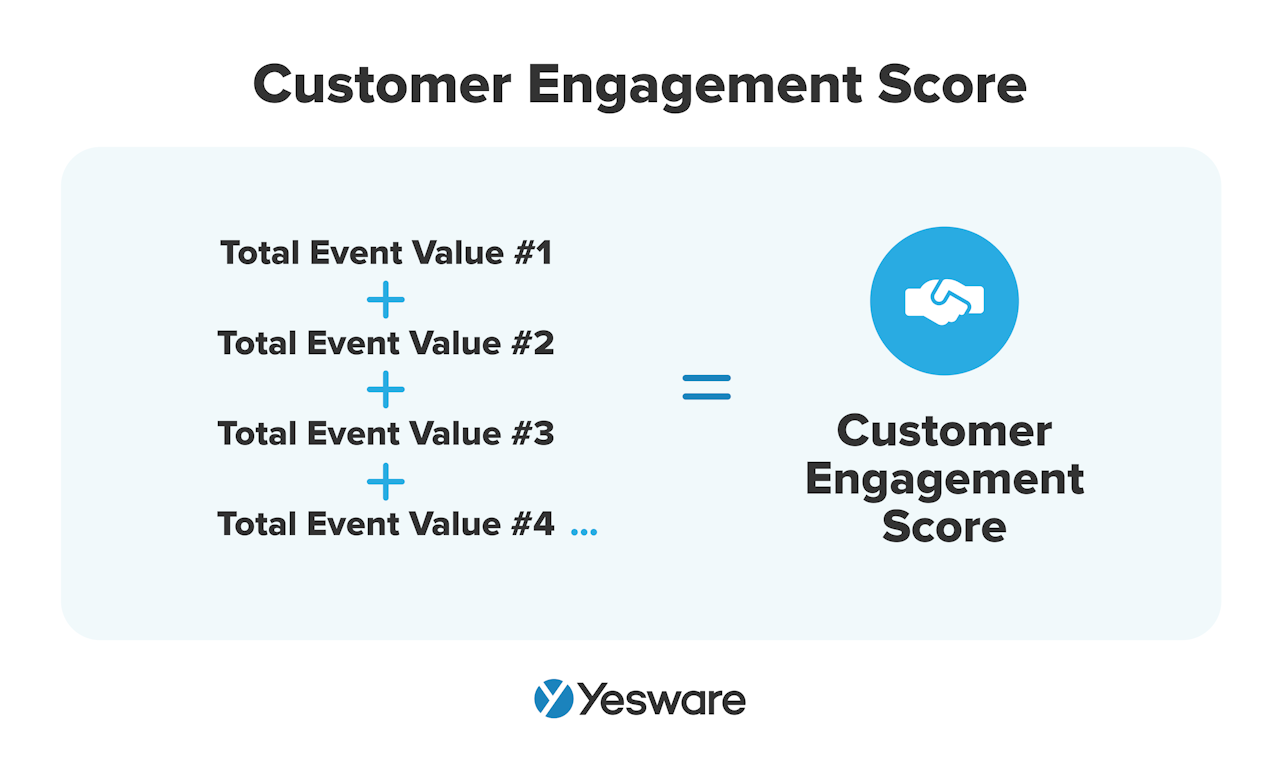
CES tells you more than just how happy your current clients are. It can also shed light on how effective your lead generation strategies are, how well your prospects are being qualified, and how effectively sales reps are demonstrating value throughout the sales process.
14. Average Profit Margin
Much like MRR, the profit margin metric has a number of sub-metrics that can give insight into the profitability of your pipeline.
Organizations may use gross profit margin ratio, operating profit ratio, or net profit margin ratio. The formulas for each are as follows:
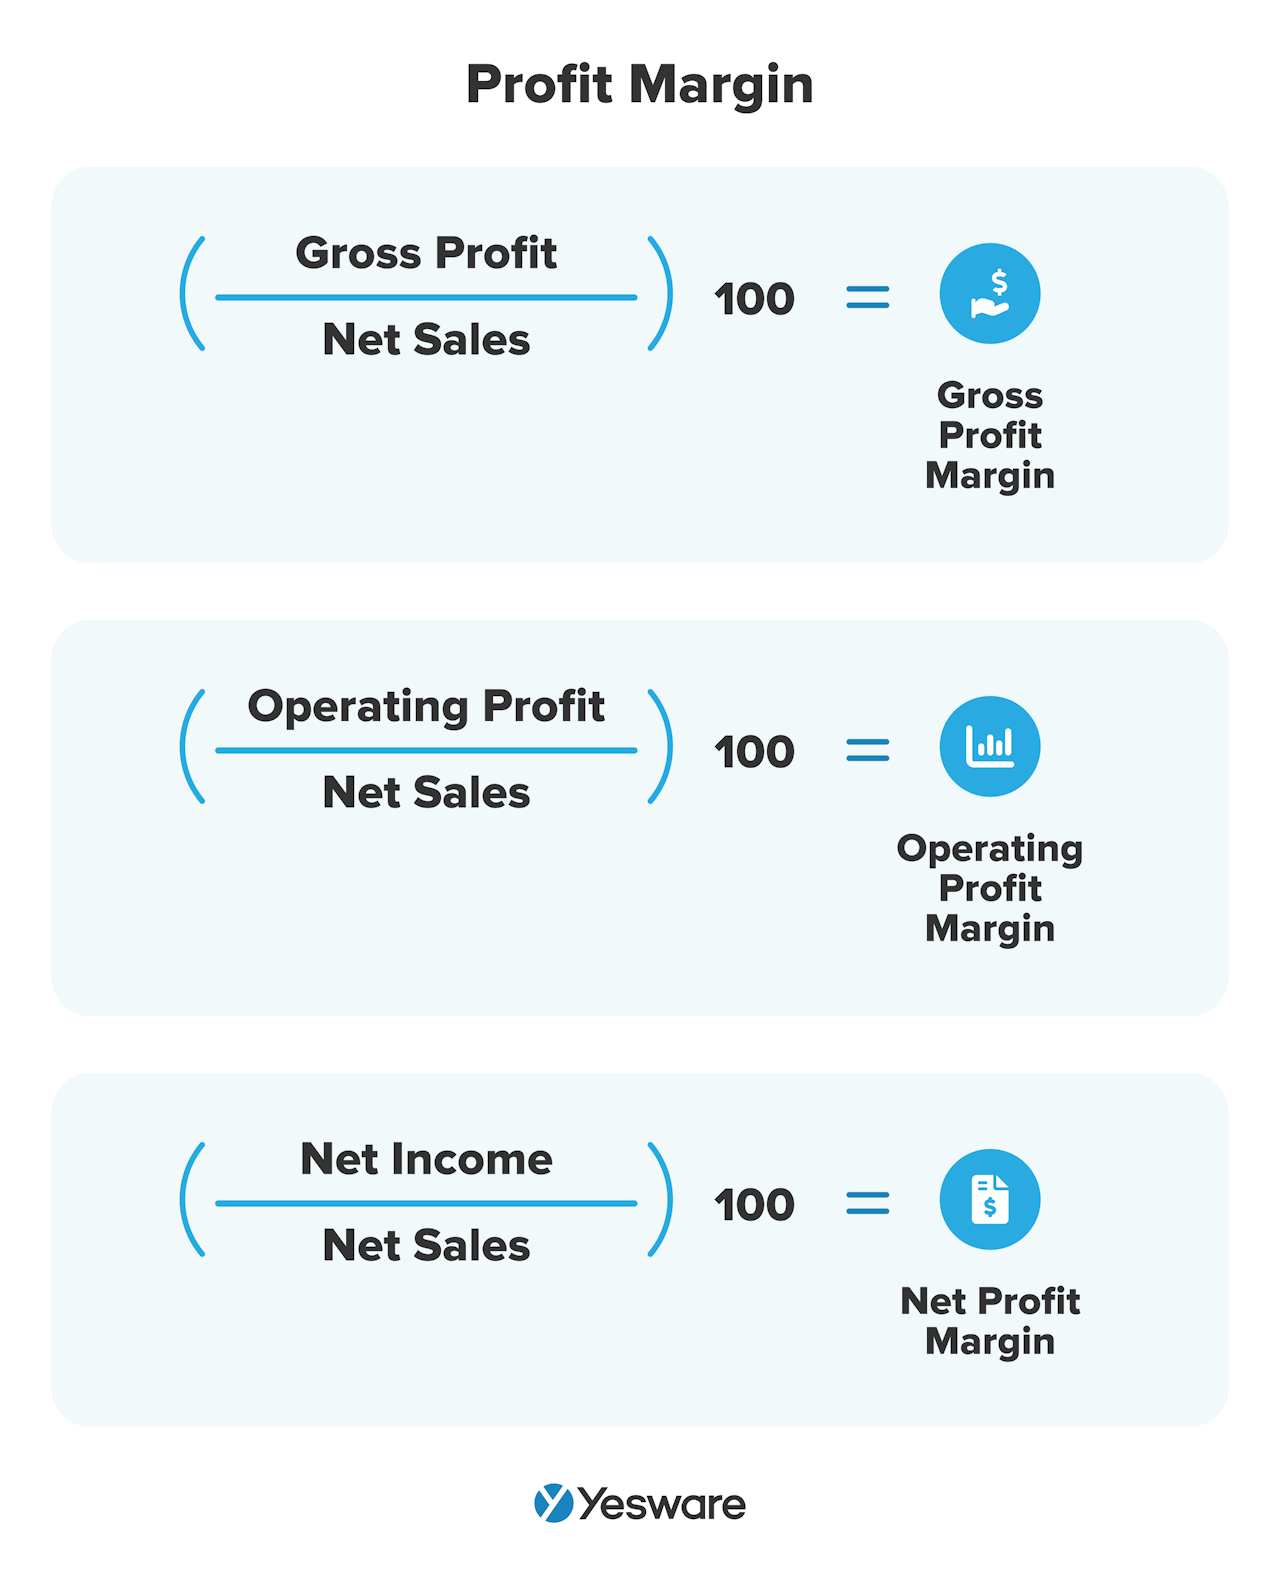 Average profit margin, in its most general form, represents your business’s profit margin over a long period of time. This can help sellers know whether they’re overusing promotions or discounts, or whether they need to direct more focus to high-ticket sales.
15. Annual Contract Value (ACV)
Annual contract value (ACV) represents the average amount of revenue that a single contract generates for the company. This metric is especially helpful for SaaS companies.
To calculate ACV, divide the total value of all contracts by the total number of years in those contracts.
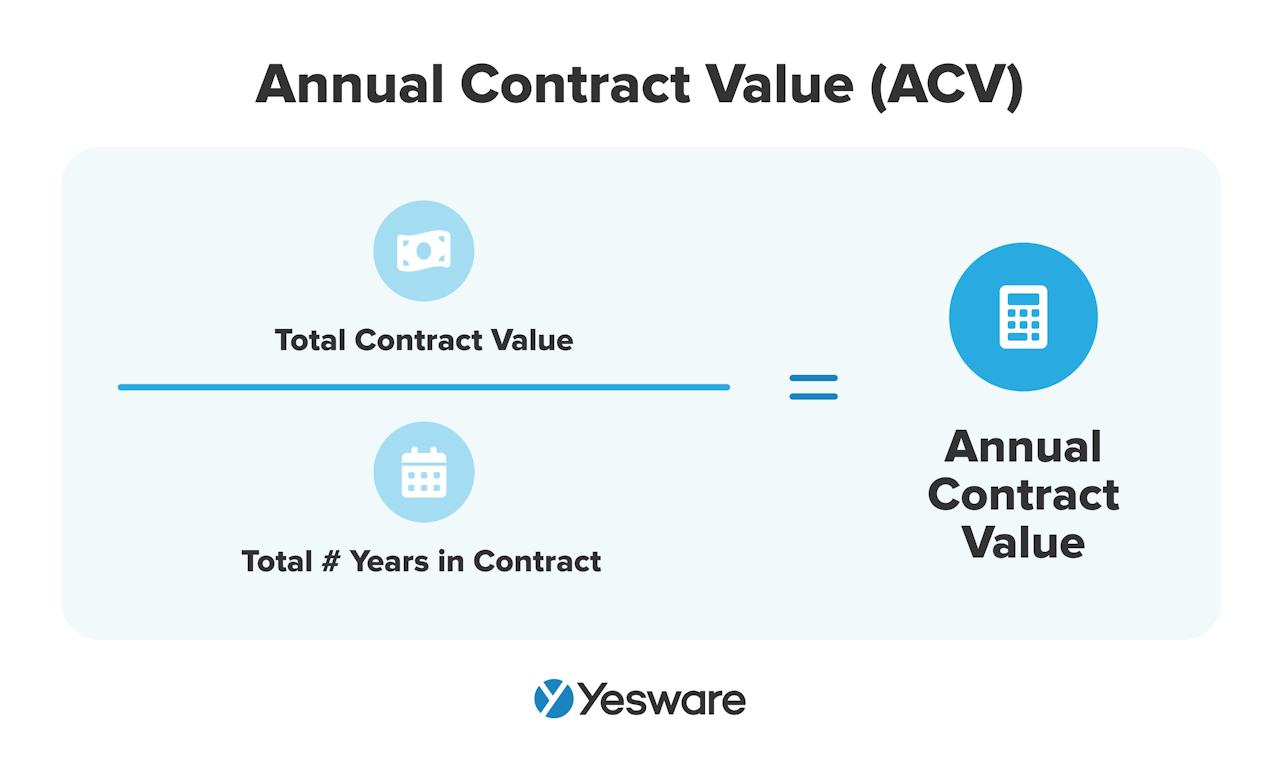
ACV can help teams determine how effectively they’re targeting high-ticket accounts, or how well they’re cross-selling or upselling products. It can also help sales leaders optimize contract terms.
16. Sales by Contact Method
Calculating sales by contact method can help teams determine their most effective sales channels.
This is a pretty simple metric to calculate: divide the total sales for a given contact method by the total revenue.
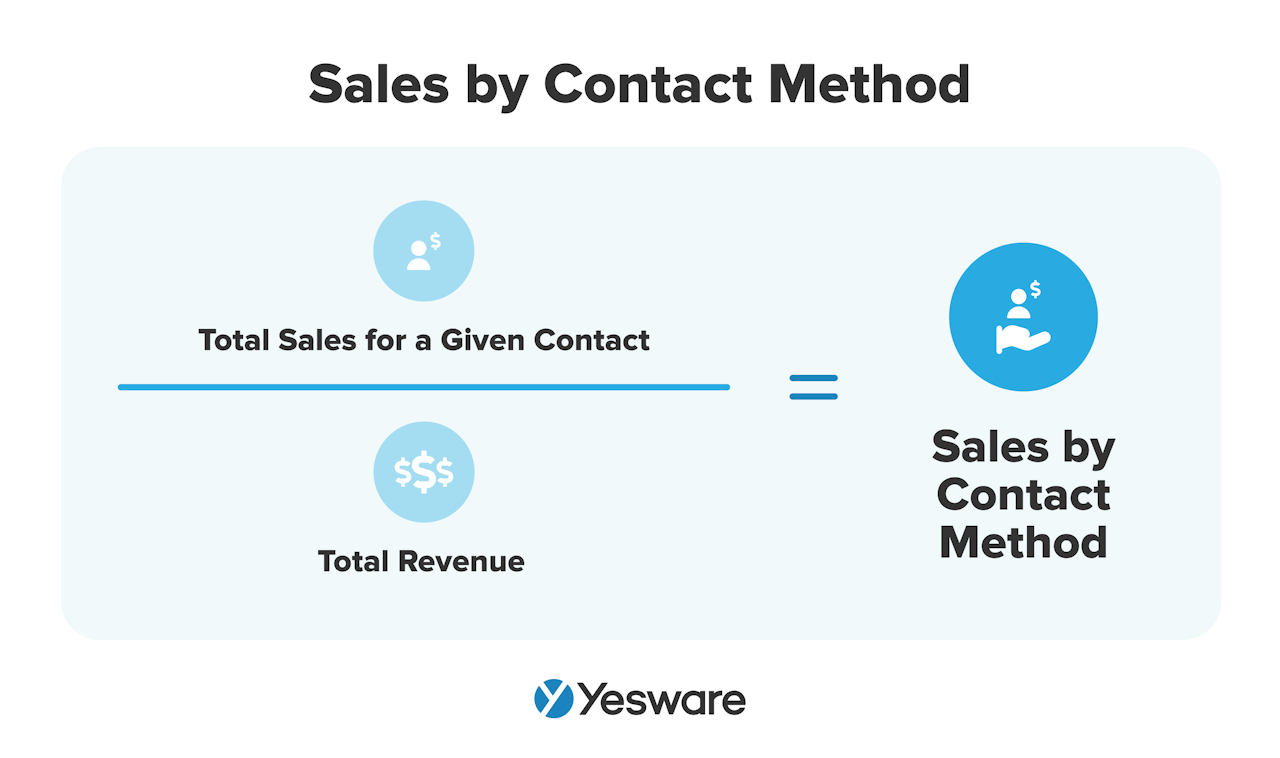
It’s important for sales teams to note that this metric can tell you more than just how your prospects prefer to be contacted. Sales by contact method is also an important metric for determining the most efficient method and cadence of contact for your target demographic.
We know, for example, that email outreach is generally cheaper than phone. Sales teams can use what they know about their sales performance by contact method and use that data to strategize and optimize their outreach efforts.
Pro Tip: For guidance on choosing the right tool for your email metrics, check out The 10 Best Free Sales Tracking Software in 2025.
17. Lead Conversion Rate
Lead conversion rate tells sales teams the percentage of their leads that ultimately convert to customers.
Sellers sometimes refer to this as simply “conversion rate.”
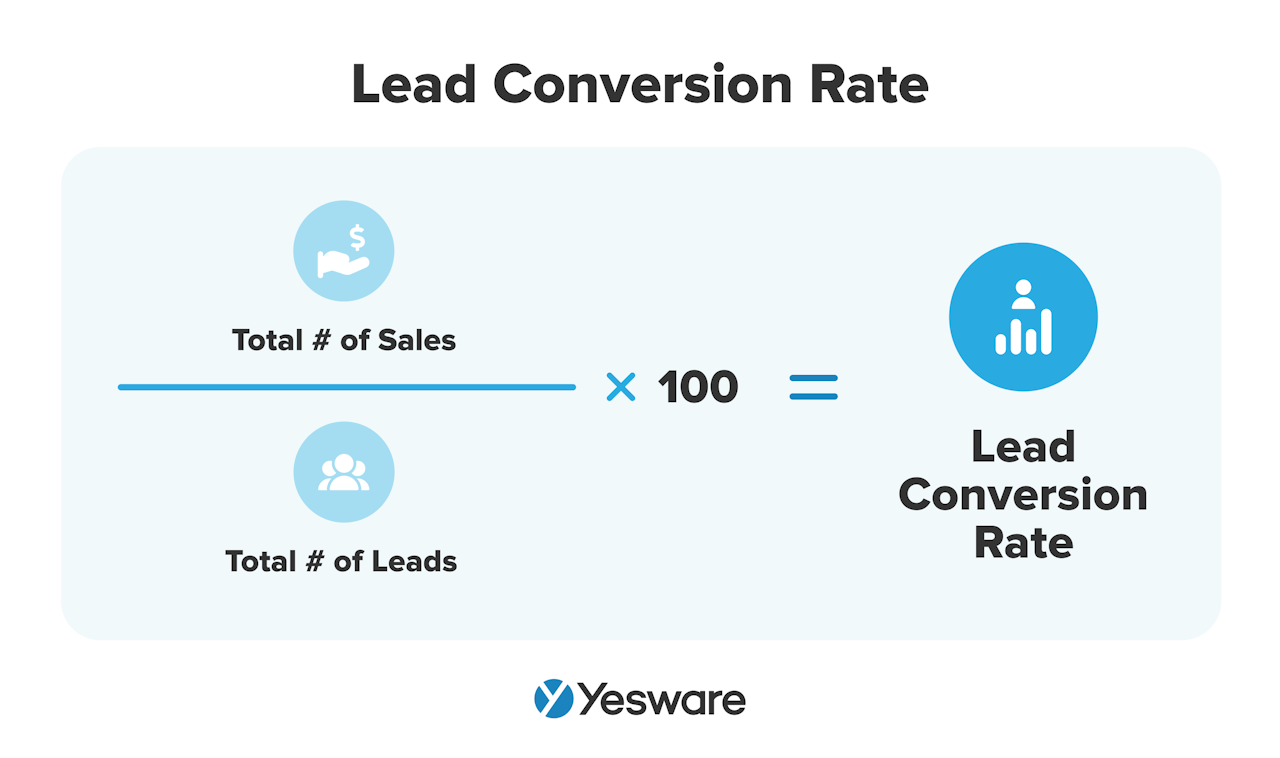
This metric can shed light on how well your lead generation strategies are targeting your ICP.
18. Upsell and Cross-Sell Rates
Upselling and cross-selling are important components of any successful sales organization. After all, it’s up to 25x easier to sell to an existing customer than it is to sell to a new one. It’s important that sales teams take advantage of these opportunities.
To calculate upsell and cross-sell rates, take the total number of upsells or cross-sells, and divide it by the total number of sales, then multiply by 100.
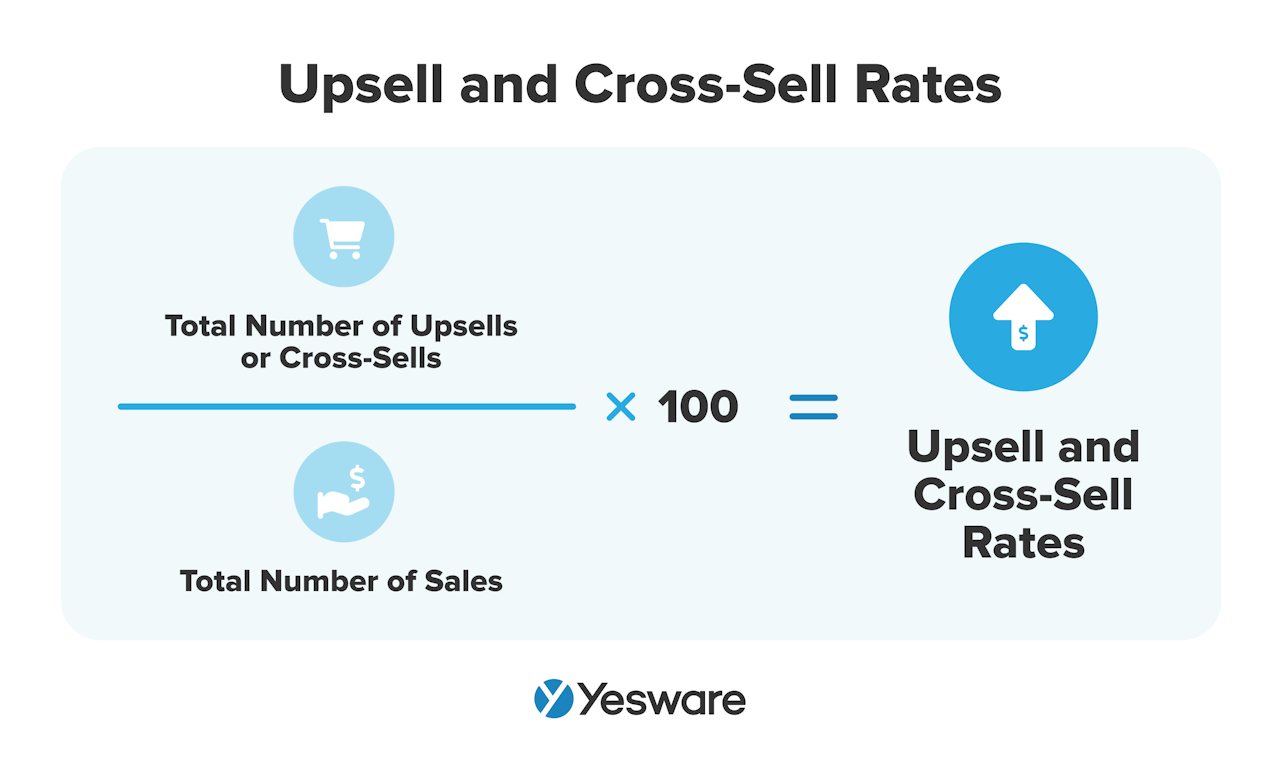
Upselling and cross-selling can also be good indicators of future referrals, which can also have huge impacts on your bottom line.
Tip: Looking for more ways to improve team outcomes? Our free ebook below for sales managers covers tons of strategies and processes to do so.
 Sales Management Training GuideEverything you need to know to be a successful sales manager – backed by data and real-world experiences.
Best Practices for Tracking Sales KPIs
Here are some best practices to keep in mind as you develop routines for tracking sales KPIs.
Set Straightforward Data Requirements
Make sure everyone on your team is clear on what data they need to collect and when during the sales process, as well as where to store it. There should be standardized expectations around how, when, and where to report specific data points.
It’s also important that the KPIs you choose to track are actionable. To that end, try to track only the most relevant KPIs for your team, and keep in mind the context around why they’re important for your organization in light of your overall sales goals.
Use Past and Outside Data
Sales KPIs are about what’s happening in the present pipeline, but it’s also important to take into account other sources of data.
Historical sales data from past campaigns, in addition to data from competitors and industry-wide trends, can all give good benchmarks for how your current sales KPIs measure up.
Treat Your Customers Like People
Sales KPIs are only as useful as the data they’re based on, but sales reps also need to remember that each data point they calculated was generated by real people with real needs and opinions.
Look for opportunities to personalize the process wherever you can; those efforts will be reflected in your KPIs.
Define Each Stage of the Funnel
When it comes to tracking sales KPIs, sales teams will see their best results when they define specific KPIs for each separate stage of the sales funnel.
In other words, look for behaviors or data that indicate how and why prospects move from one stage of the process to the next. This will help you identify bottlenecks and/or strengths in the process.
How to Leverage Sales KPI Dashboards
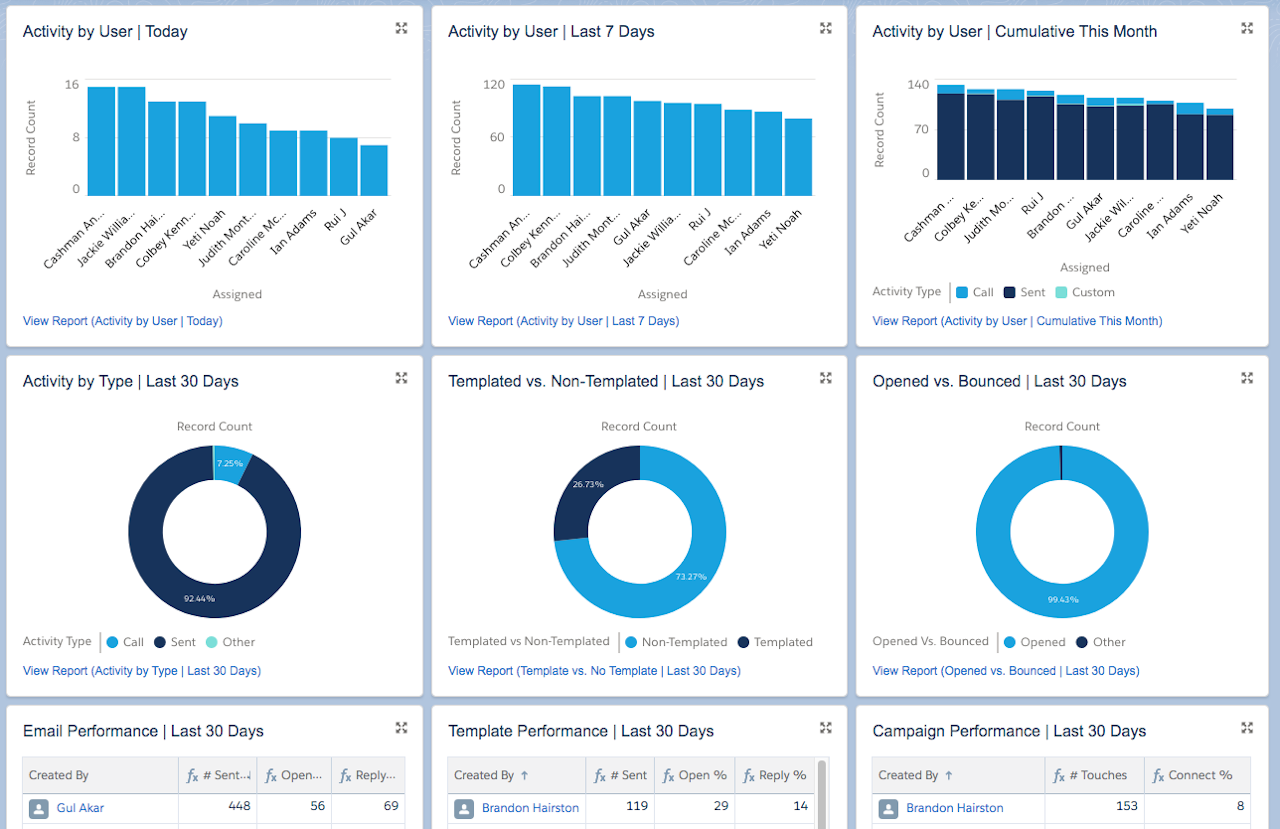
A sales dashboard is a visual representation of sales data. Here’s an example:
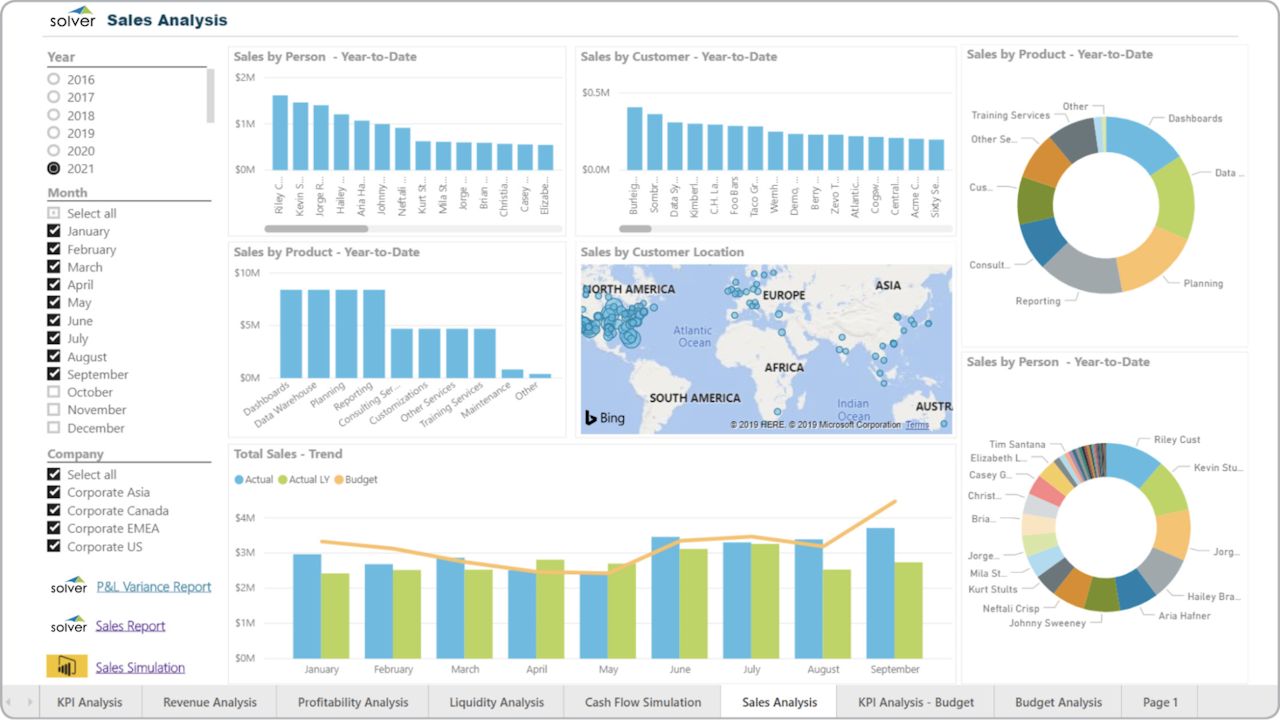
The specific data displayed on a sales dashboard depends on the team and its unique sales goals, but all dashboards are designed with the intention of giving salespeople an easy-to-read way of staying up-to-date about what’s impacting sales revenue growth.
The most capable sales dashboards work alongside a powerful CRM system and can and should be used by everyone on the sales team.
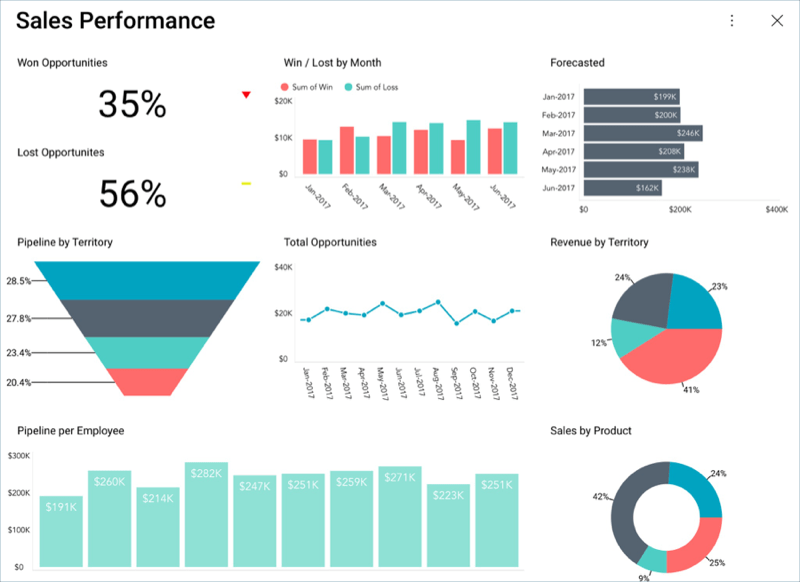
Sales Leaders and CROs: Home Dashboard
Most sales dashboards show a general “State of the Union” view, like the Salesforce version, with a broad-level overview of the most important year-to-date KPIs.
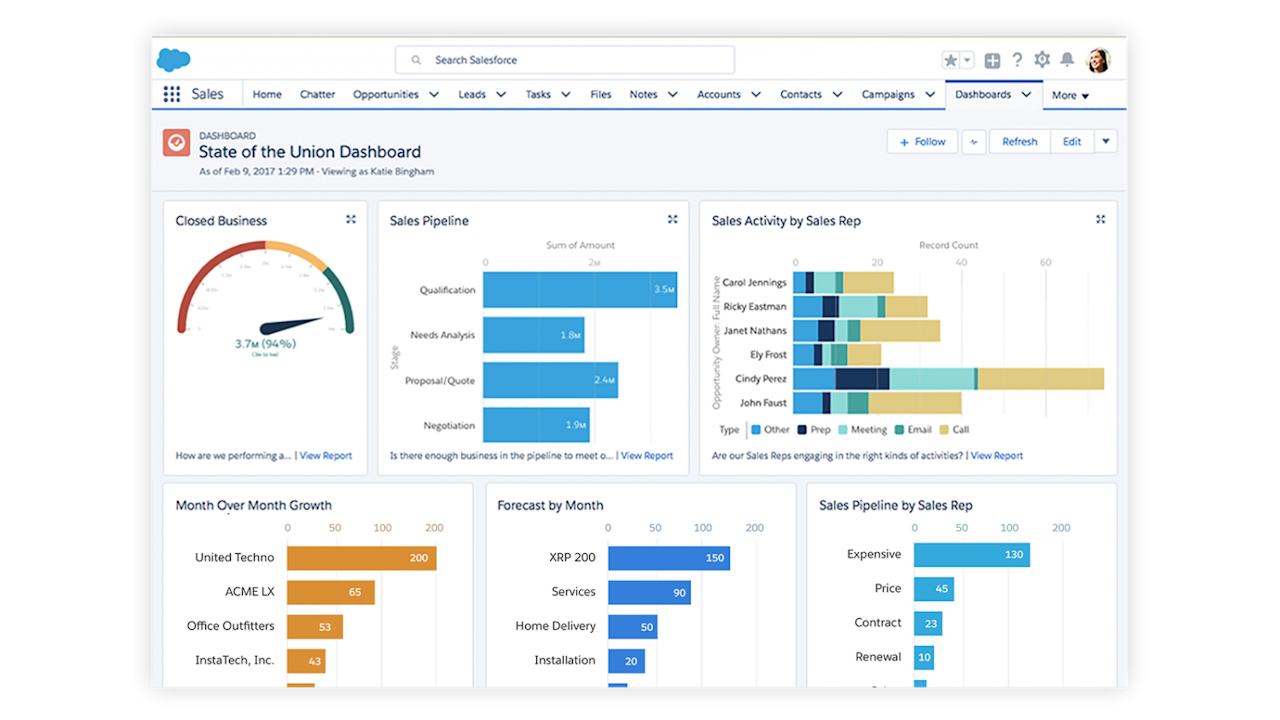
It also often shows recent or noteworthy open and closed deals, top-performing sales reps, and sales performance compared to sales forecasts.
Sales Managers: Pipeline Dashboard & Team Activities Dashboard
A Pipeline Dashboard shows each sales rep’s progress on their own pipeline, as well as average sales cycle length, average deal value, and overall and individual conversion rates.
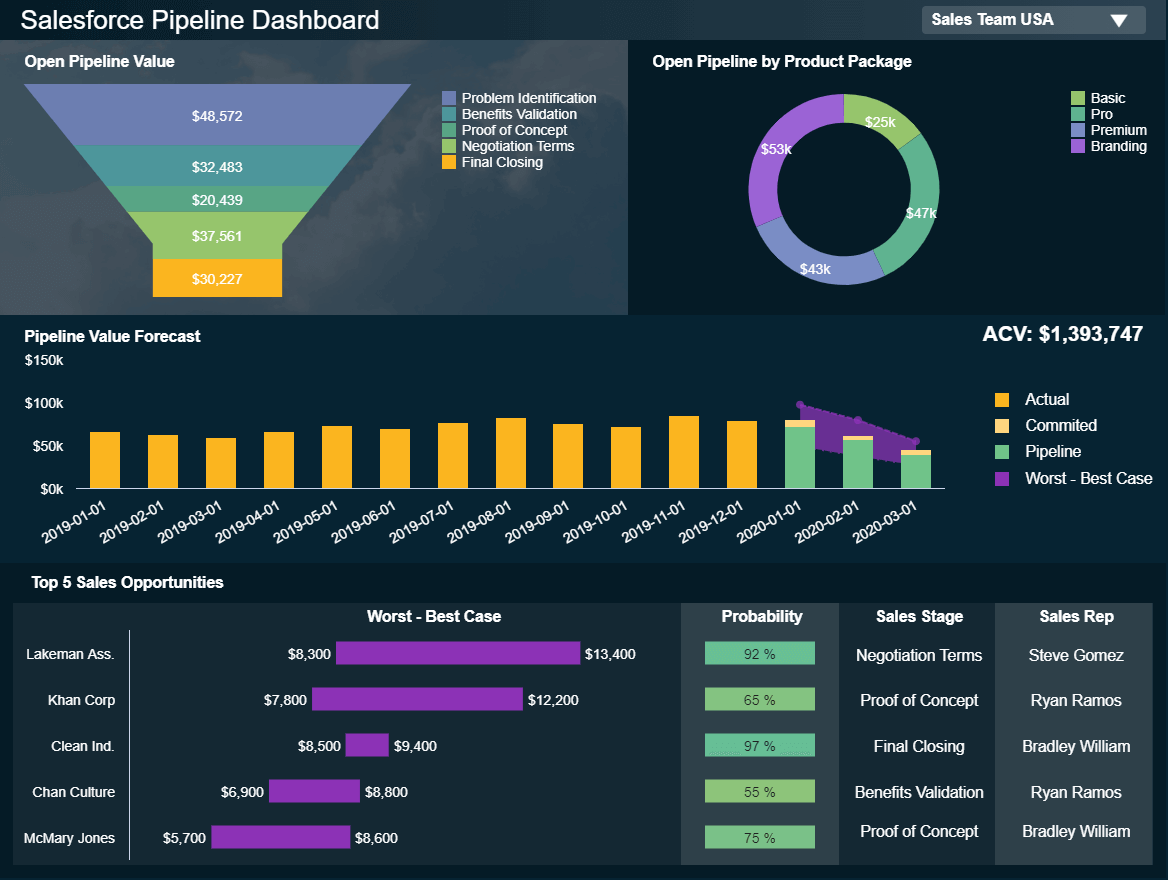
A Team Activities Dashboard gives insight into what sales activities are being performed on a day-to-day basis. This sales dashboard usually shows recently completed sales tasks, as well as those that are ongoing and overdue.
Tip: Grab this Yesware + Salesforce dashboard here.
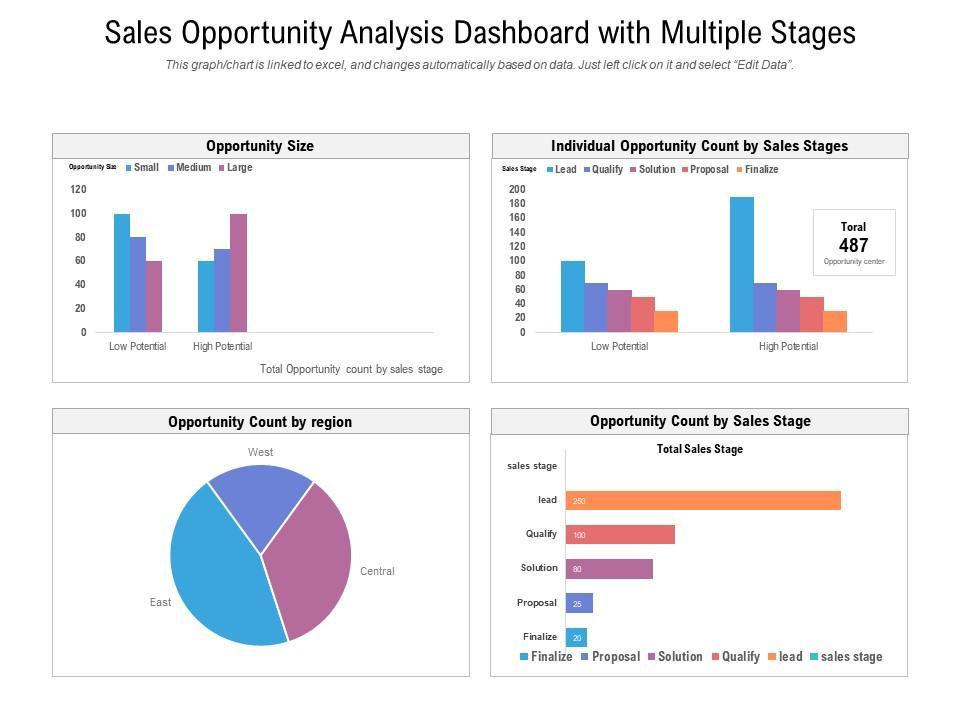
Sales Ops: Performance Dashboard & Stage Analysis Dashboard
A Performance Dashboard displays closed deals by different variables: territory, sales rep, product, etc. This differentiation allows sales managers to better understand what factors might be contributing to conversion rates.
A Stage Analysis Dashboard lets sales reps look at trends and patterns. It gives insight into the way buyers move through the stages of the pipeline and where those who ultimately don’t purchase become at risk.
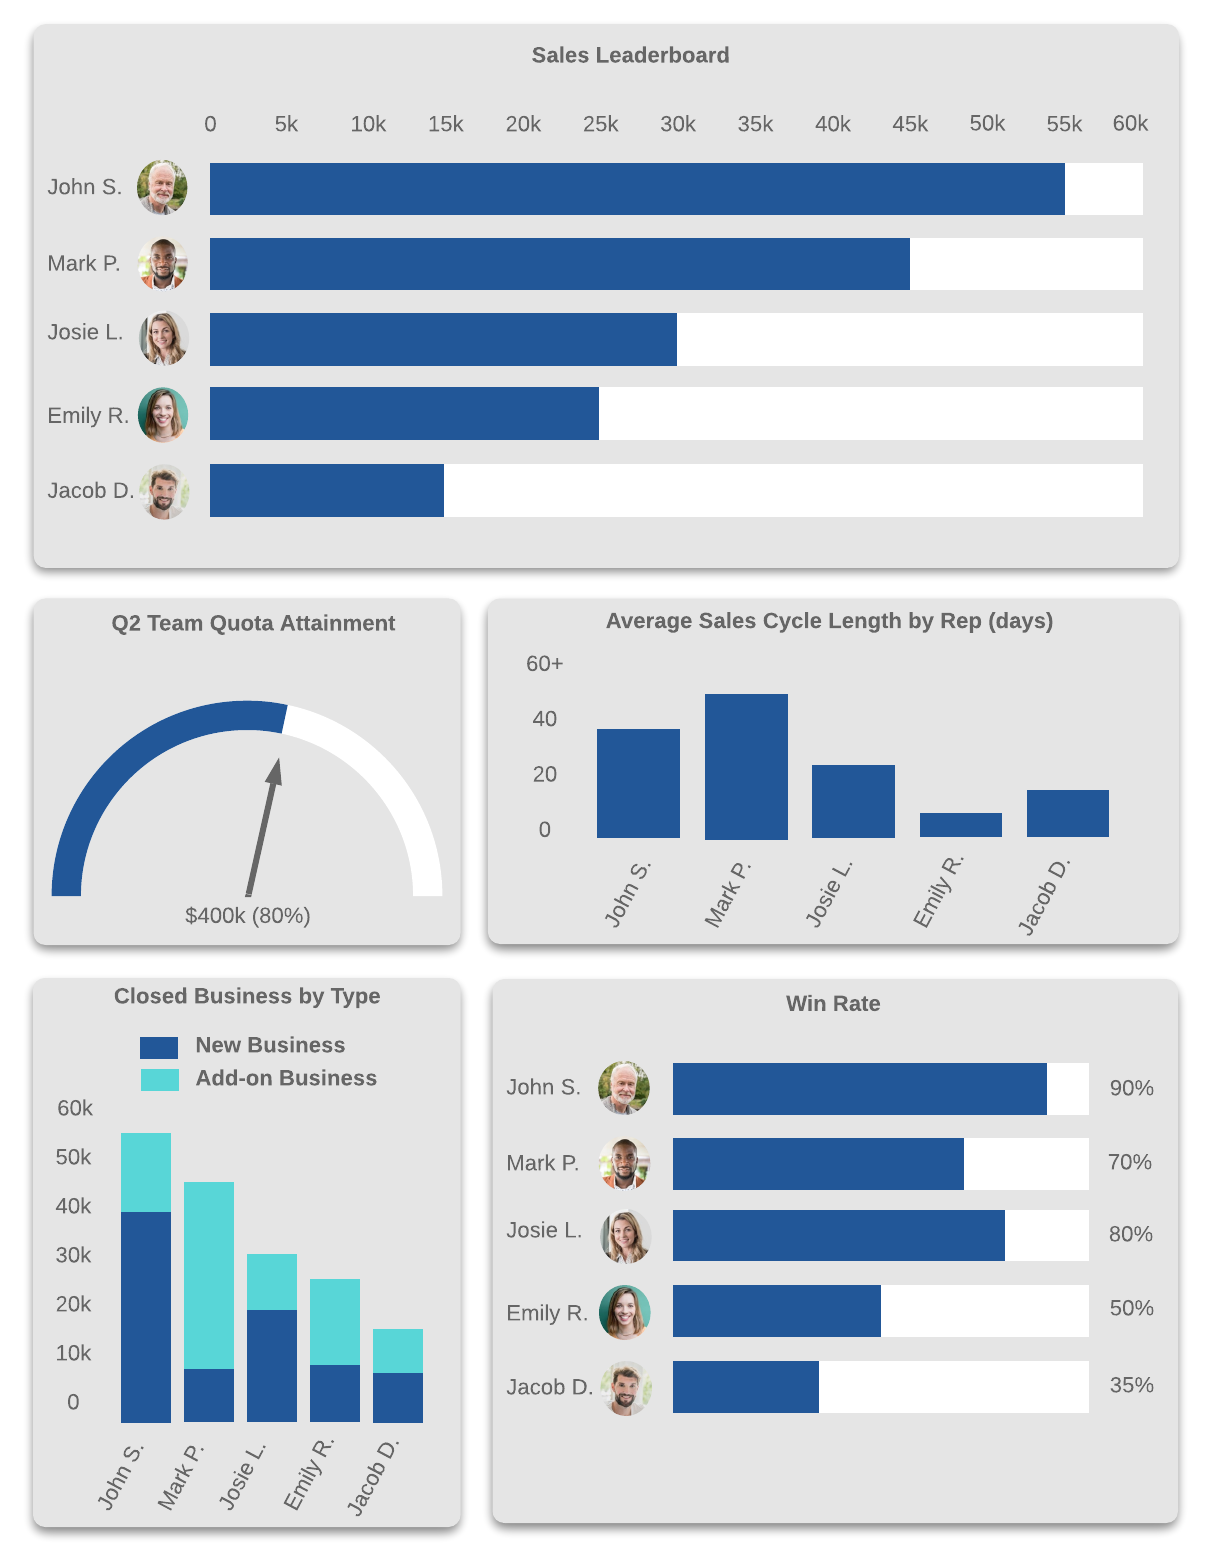
Sales Reps: Rep & Team Leaderboard Dashboard
These dashboards give sales reps a look at how they’re doing in terms of quota attainment, sales cycle time, sales productivity, and whatever other factors are important to them and their managers.
Which sales KPIs do you focus on most heavily at your business? Which ones have given you the most insight into your sales effectiveness? And which ones will you be focusing on in the coming year?
This guide was updated on September 6th, 2023.
Get sales tips and strategies delivered straight to your inbox.
Yesware will help you generate more sales right from your inbox. Try our Outlook add-on or Gmail Chrome extension for free, forever!
Related Articles


Casey O'Connor
![Sales Velocity: What It Is + How to Calculate It [Examples]](/blog/_next/image/?url=https%3A%2F%2Fwww.yesware.com%2Fwp-content%2Fuploads%2F2022%2F03%2Fsales-velocity-yesware.jpg&w=1280&q=75)
Casey O'Connor

Casey O'Connor
Sales, deal management, and communication tips for your inbox