Sales Reporting: How to Create, Manage, & Improve Your Sales Reports


If a sales team wants to improve their sales process and grow their revenue, sales reporting is one of the most important processes to get right.
Sales reports provide sales reps and managers insight into individual performance, as well as the team’s overall progress toward sales goals. They also help create sales forecasts and contribute to team cohesion.
In this article, we’ll go over everything you need to know about sales reports, including what they are, why they’re so important, and how to create them. We’ll also look at some best practices for sales reporting.
Here’s what we’ll cover:
- What Is Sales Reporting?
- Why Is Sales Reporting Important?
- Types of Sales Reports
- How to Create a Sales Report
- How to Manage Your Sales Reports
- Sales Reporting Best Practices
What Is Sales Reporting?
Sales reporting is the practice of tracking, compiling, analyzing, and generating insight from sales activities and their results.
A sales report is simply a document that summarizes a sales team’s or individual sales rep’s activities, as well as the specific outcomes that resulted from those activities.
Sales reports may include any number of details and varied sales information, including but not limited to:
- Number of sales
- Total value of sales
- Total revenue
- Average sale value
- Number of upsells
- Number of cross-sells
- Average lead response time
- Number of outbound calls
- Number of outbound emails
- Conversion rate
- Number of follow-ups
- Number of renewals
- Average length of the sales cycle
- Product return rate
- Churn rate
- Customer acquisition cost
As you can see, sales reports can provide a variety of insights for sales reps and sales managers.
In addition to highlighting specific strengths and performance gaps, sales reports can also help sales managers determine the effectiveness of specific sales methodologies, create sales forecasts, identify sales patterns, and more.
Sales reporting is an ongoing process. The practice is most effective when sales managers continuously monitor and optimize how their reports are generated and leveraged within the sales process.
Why Is Sales Reporting Important?
Sales reporting is a powerful sales tool that helps businesses evaluate and optimize their sales processes in real time, as well as assess and plan for future sales strategy and growth opportunities. 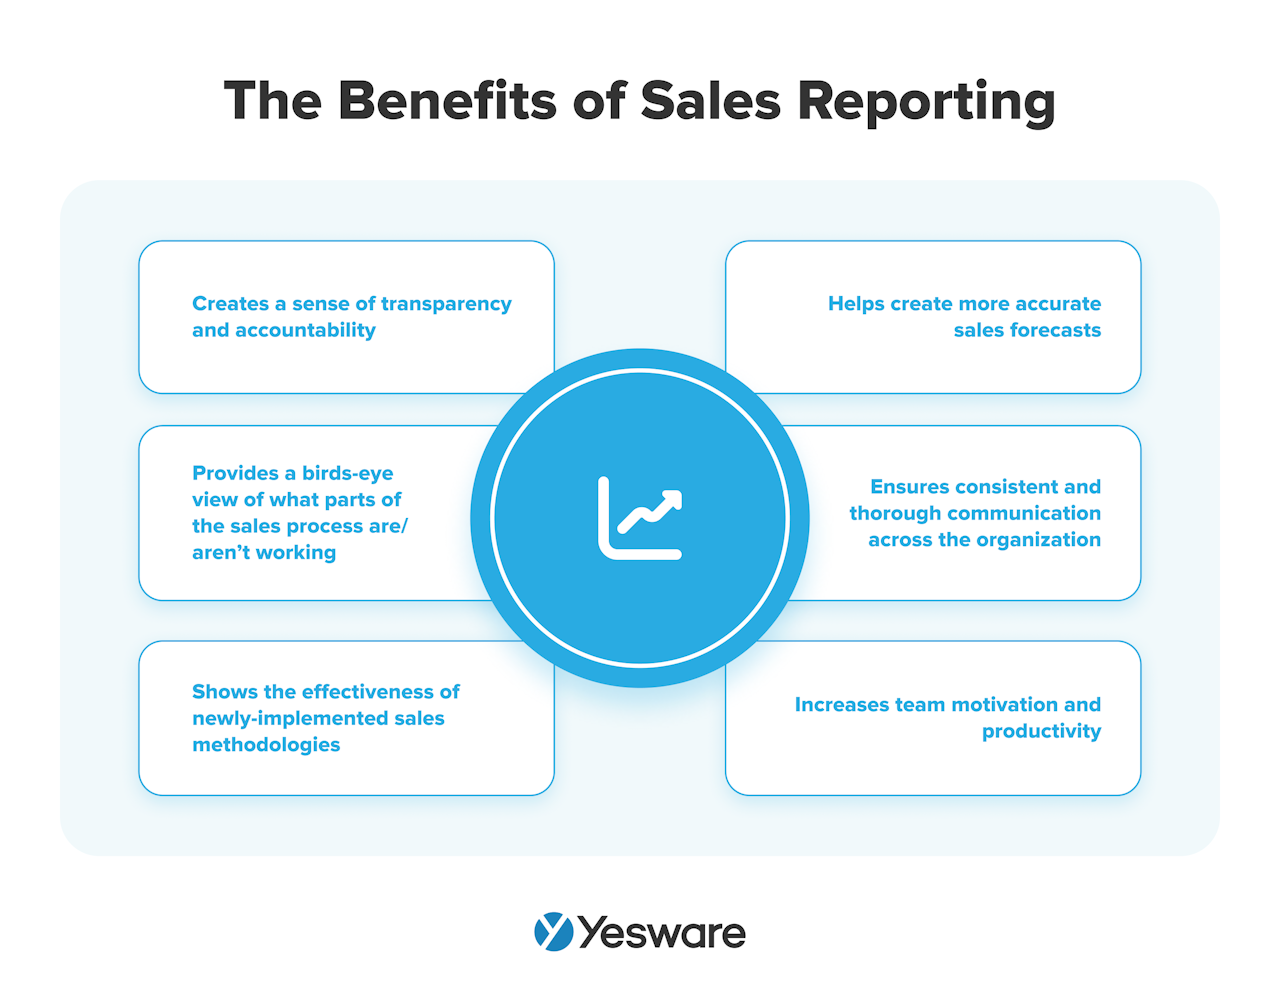 Effective sales reporting is beneficial to sales reps, sales managers, and organizations as a whole.
Helps Sales Reps
Effective sales reporting helps sales reps close more deals with less effort. The insights that reps can gather from sales reports help them identify specific things they can do more of (or less) in order to move more deals through the pipeline.
Sales reporting also creates a sense of transparency and accountability among sales reps. They know that their efforts will be measured against their own previous results, as well as against team-wide progress and results.
Good sales reports — reports that are clear, organized, and deliver actionable insight — motivate individual sales reps to perform their best.
Helps Sales Managers
Sales reports can be very useful tools for sales managers, too. They provide a birds-eye view of what parts of the sales process are working smoothly, and where bottlenecks exist that need to be addressed.
To that end, sales reports can also help sales managers identify areas in which their team would benefit from group-wide training or workshops.
Sales reporting helps show the effectiveness of newly-implemented sales methodologies and strategies. It helps sales managers create more accurate sales forecasts, and can highlight patterns or trends (this can be especially useful in territory-based sales).
And because sales reports can be designed to include granular-level detail about the sources of your team’s most promising leads, they make it easy for sales managers to optimize their lead generation process and strategies.
Helps the Organization
Sales reporting can also be beneficial when it comes to staff turnover and onboarding. Because sales reports include many specific details about sales activities and their corresponding results, they make it easy to maintain continuity and ramp up new hires quickly.
Sales reporting also helps ensure consistent and thorough communication across the entire organization.
Sales reporting has a number of wide-reaching benefits that impact far more than just the sales team. The practice helps organizations make data-driven decisions about big-picture and day-to-day issues.
Types of Sales Reports + Examples
There are many different types of sales reports, and everything from the design to the content of your team’s reports will ultimately be determined by your team’s unique needs, goals, and reporting practices.
Because sales reports — also sometimes known as sales analysis reports — vary so widely in their data, frequency, and featured sales KPIs, it’s generally best practice for sales, marketing, and sometimes customer success to collaborate to identify on which KPIs they want their sales reports to focus.
Following are some of the most common types of sales reports.
Sales Forecasts
A sales forecast is a sales report that makes a prediction about the number of sales your organization will achieve in a certain time period. Here’s an example:
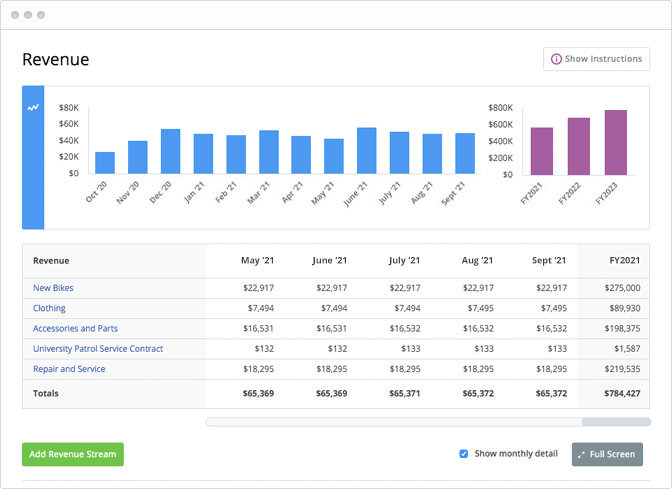
Sales forecasts are important for investors and resource planning.
Sales Funnel Reports
A sales funnel report can give sales teams information about how close individual leads are to making a purchase. Here’s an example:
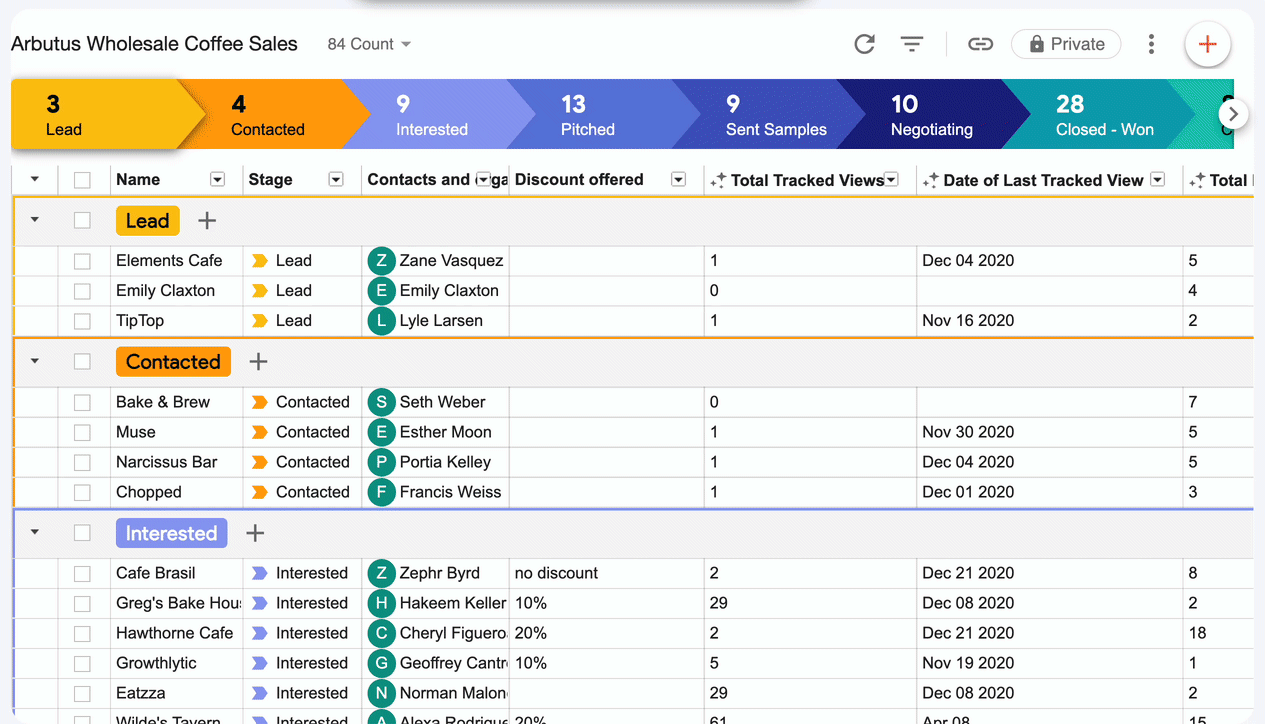
This type of sales reporting helps sales reps compare and prioritize leads so that they know where their efforts are most likely to have an impact. A sales funnel report can also be very helpful in identifying specific weaknesses in the sales pipeline.
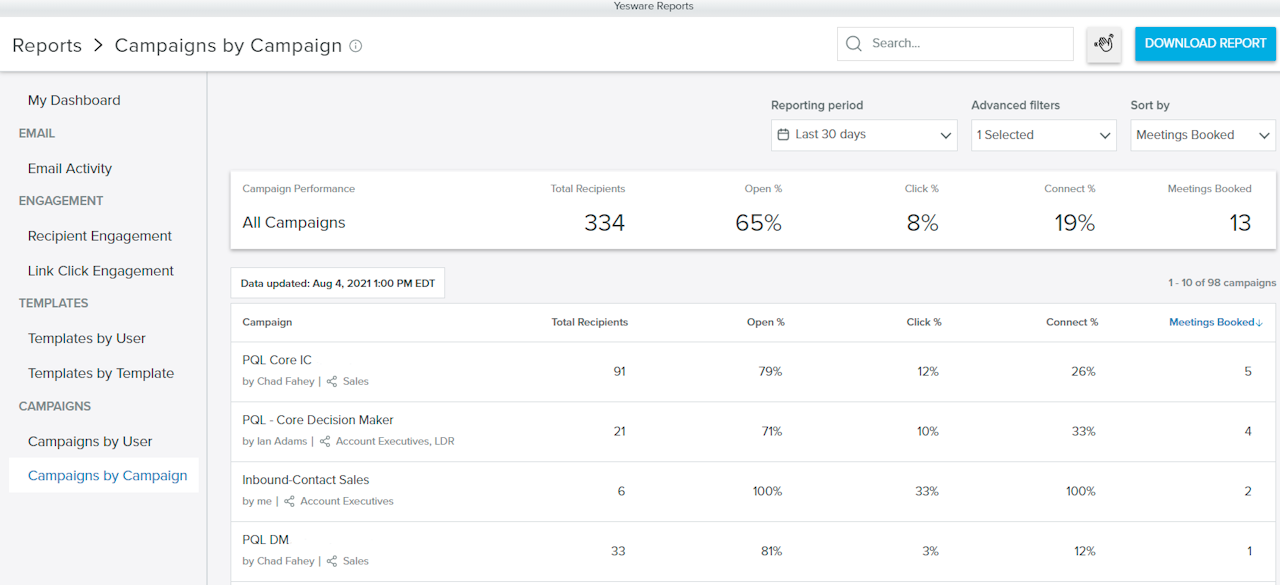
Sales Outreach Reports
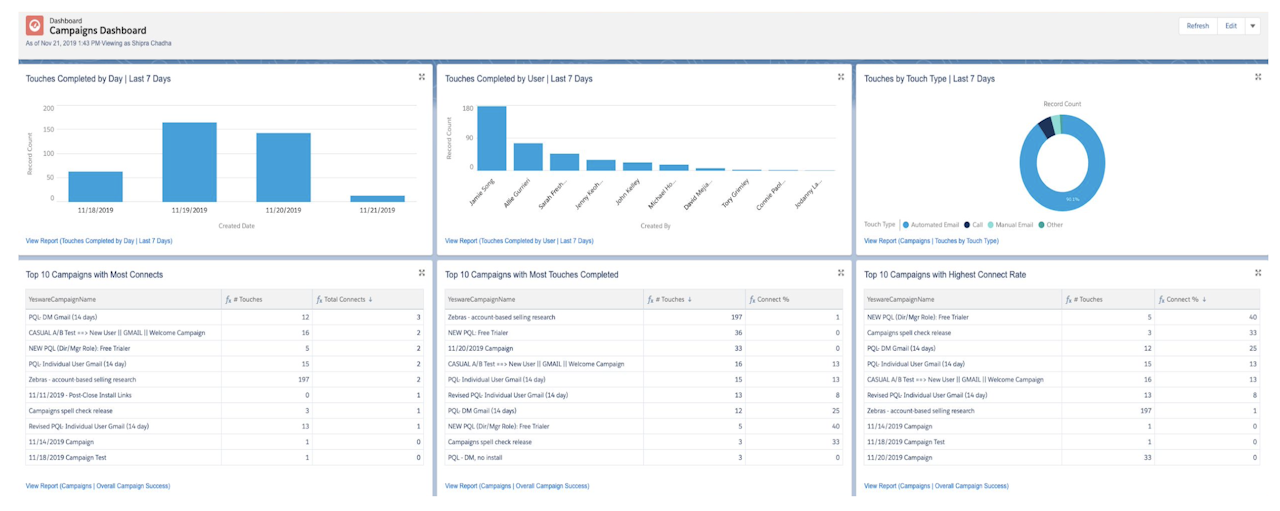
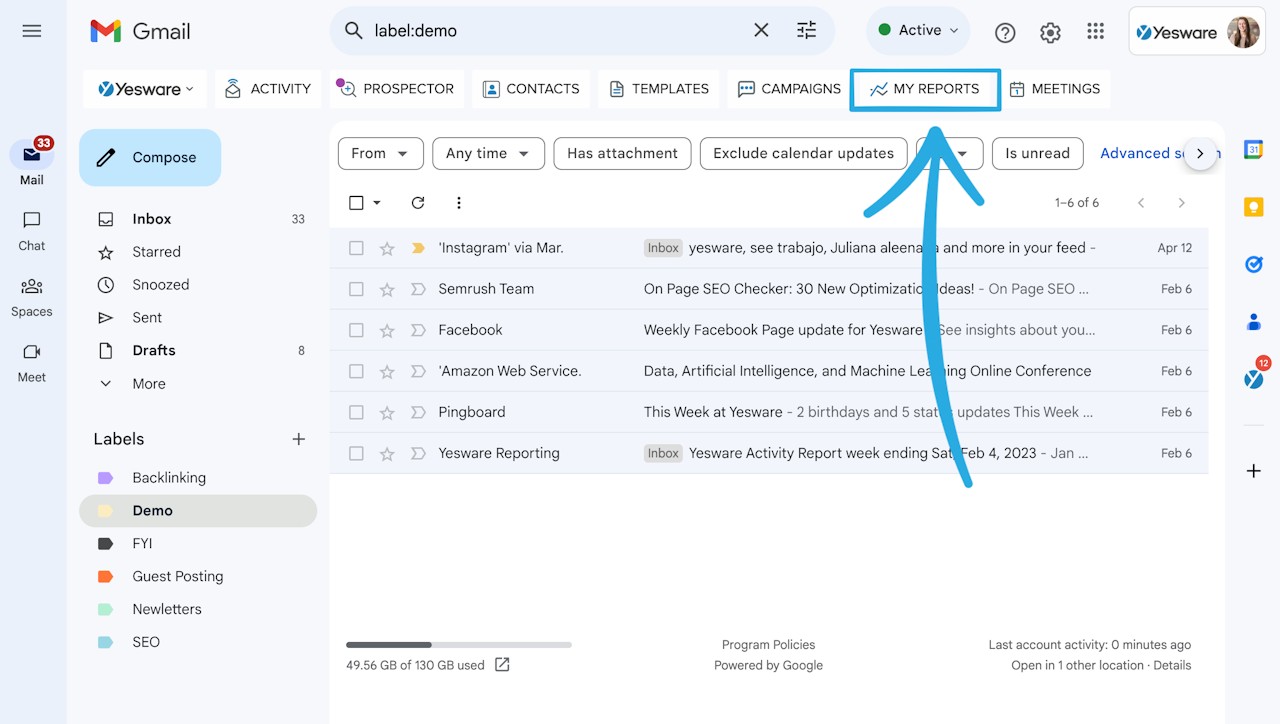
Some sales reports dive deep into specific sales behaviors. Sales outreach reports, for example, can include information about how, when, and with what information sales reps reach out to leads — and with what results. This kind of report helps sales teams optimize their lead generation and lead qualification processes.
Here’s an example of one of Yesware’s inbox reports on campaigns:
And here’s an example of Yesware’s Salesforce reports that help visualize campaign outcomes:
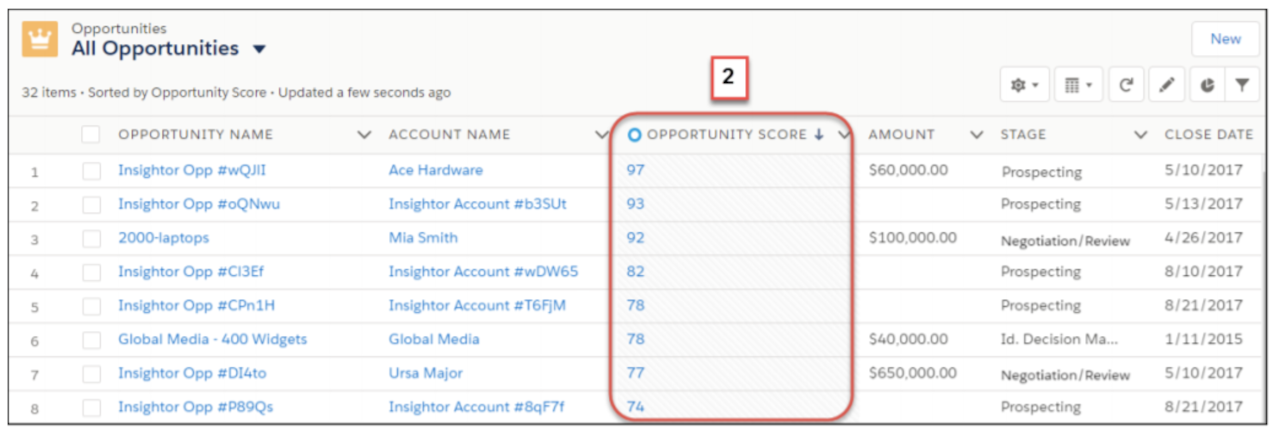
Opportunity Score Reports
Opportunity score reports use the Einstein opportunity score to assess how likely leads are to convert to sales. The Einstein score is generated by AI, and gives each lead a score between 1 and 99; the higher the score, the more likely they are to become a paying customer.
Salesforce has a field dedicated to opportunity score:
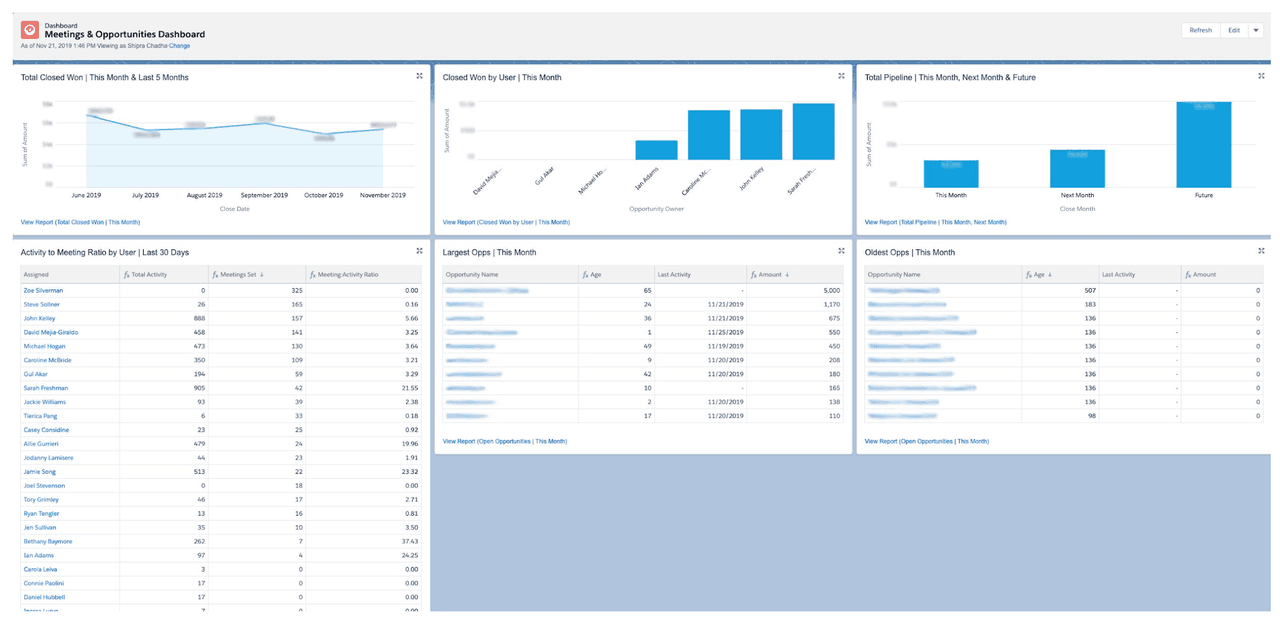
Deals Won by Sales Rep
Some sales reports can give insight into individual sales reps’ performance. A “Won by Sales Rep” sales report, for example, gives insight into how effectively each sales rep closes opportunities that entire their pipeline. Here’s an example:
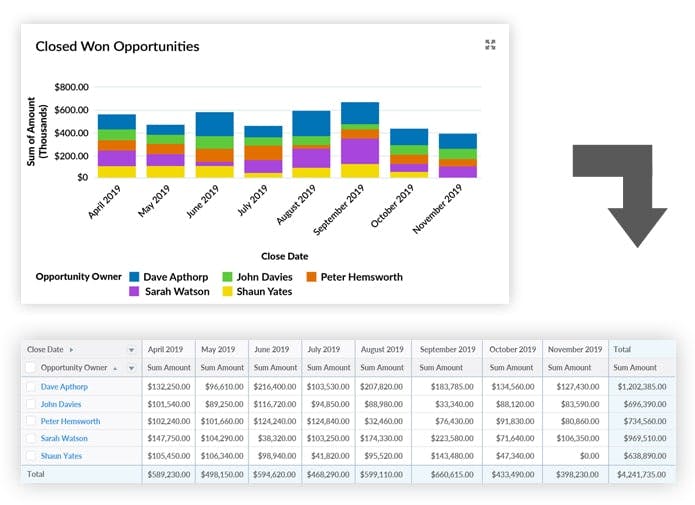
Sales managers can use this data to identify specific behaviors that top performers rely on to get their results.
Weighted Sales Forecast
A weighted sales forecast is a type of sales report that helps sales reps analyze how likely each opportunity in their pipeline is to close. Managers can also use this report to get a birds-eye view of the pipeline as a whole. Here’s an example:
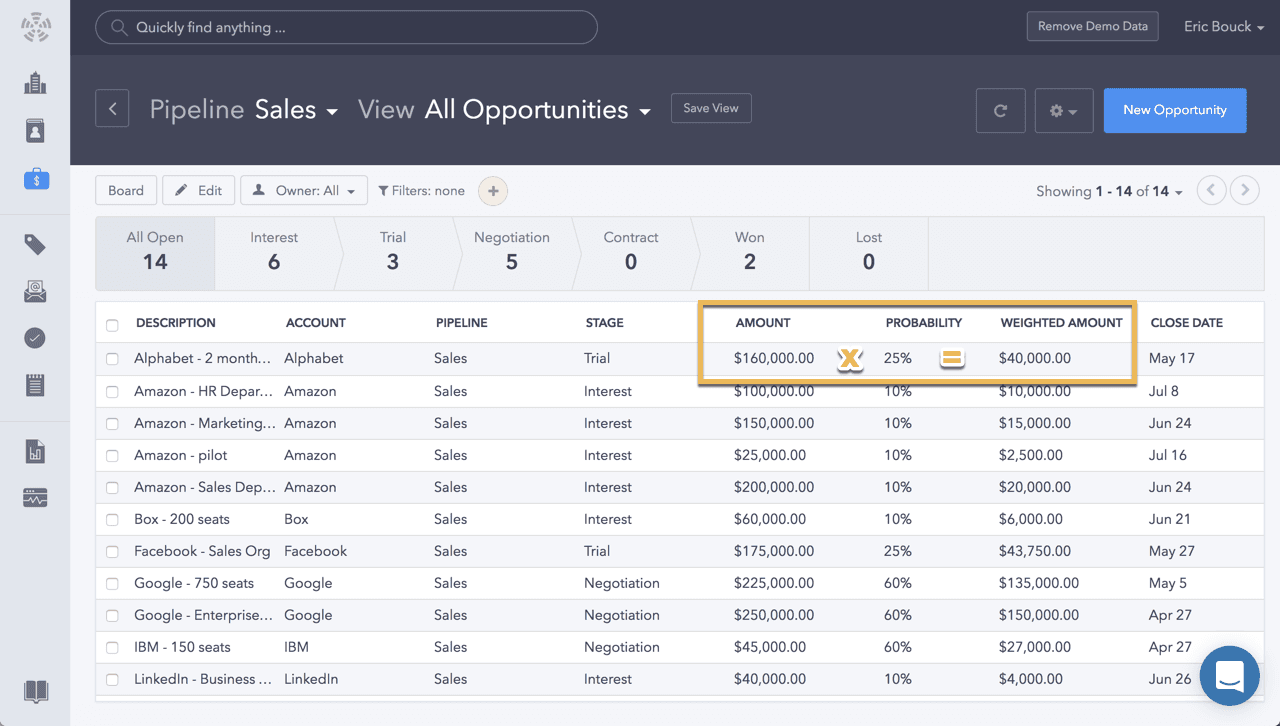
The general weighted sales forecast formula is as follows:
(Probability of the deal closing) x (Value of the deal) = Weighted value
This sales report helps sales reps prioritize their resources realistically and efficiently.
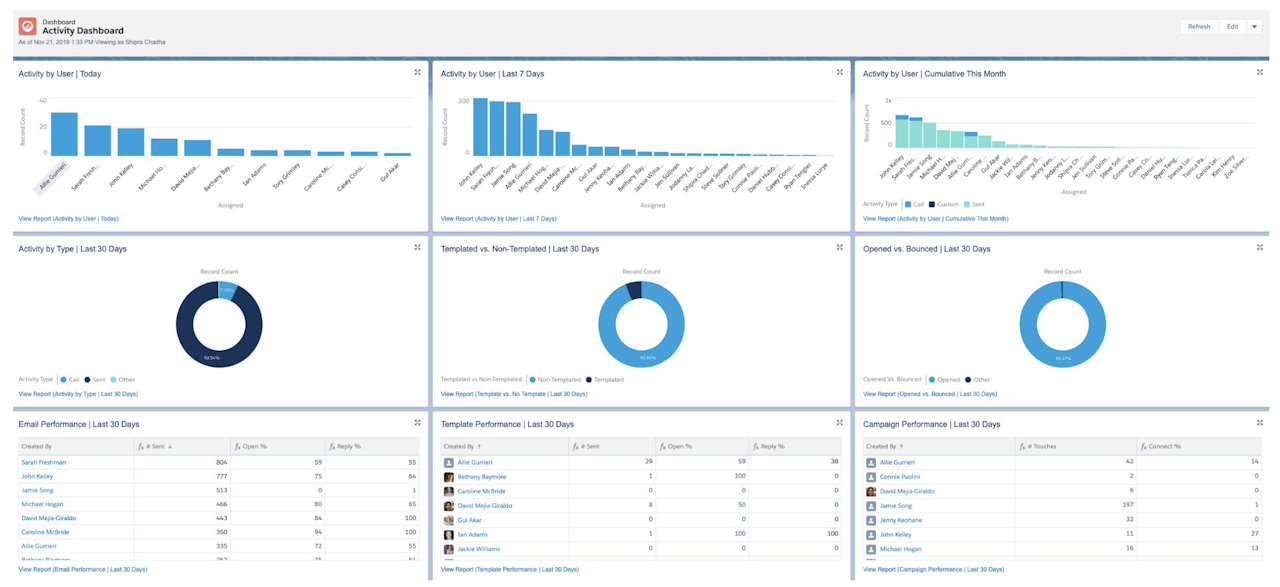
Sales Activity Reports
Sales activity reports help sales managers view performance and productivity across the board. This type of sales reporting is helps give manager’s a quick view their team’s progress.
Here’s an example of the Yesware + Salesforce Activity Dashboard:
One of the great things about sales reporting is that it’s extremely flexible and can be adapted to fit the needs of just about any sales team.
Sales reports can be generated on a daily basis for teams that need it (e.g., number of cold calls or number of leads generated); on a weekly basis (number of deals closed; number of demos presented), or on a quarterly or annual basis as needed. They can also be used to track and improve virtually any KPI.
How to Create a Sales Report
Although there are a limitless number of ways to compile and design a sales report, fortunately, the process of creating one is more or less uniform, regardless of its content.
The following steps will help you get started in creating a sales report with and for your team; feel free to change or adapt as needed to fit the needs of your organization.
1. Decide the Focus of Your Report
Before you begin creating a sales report, you need to identify what you’ll be reporting.
Sales reports come in all kinds of designs and highlight all kinds of data, and it can be easy to lose sight of the forest for the trees.
Make sure you have a clear focus for your sales report before you begin collecting data and designing your report.
2. Determine Your Current and Previous Periods
Many sales reports compare two periods of data. If this is the case for your report, make sure you clearly define the parameters of your current and previous periods (and future periods, like would be necessary for a sales forecast). The time periods should be of identical length to ensure accurate reporting.
3. Compile Your Data
Sales reports are data-fueled documents, but they’re more than just a conglomeration of numbers and raw data.
It’s not enough to drag and dump data from your CRM. Be thoughtful about the way in which you choose, collect, and aggregate the data you’ll use in your report.
Readers of the report should glean actionable insight from what’s inside; don’t clutter your point with extraneous information.
4. Double Check Your Data and Consider the Bigger Picture
Once you have your data in one place, you’re one step closer to drafting your report.
First, though, it’s important to take a step back from the data and look at it with a critical eye.
Remember, a sales report is more than just facts and figures; it’s also analysis. Make sure your data is accurate and thorough, and see if you can account for any outliers.
In other words, consider why the data looks the way it does. This analysis will be an important component of your finished sales report.
5. Include All Relevant Information
The exact content of your sales report will depend on what exactly it aims to highlight, its audience, and the data it shows, but virtually all of them should include some variation of the following components:
- Project Overview: Sales reports should be succinct, but they also need to include enough background information that someone not in-the-know could pick it up and gain insight from it. Here, you should include the objective of the report, as well as relevant reference points from last period’s KPIs.
- KPIs & Data Breakdown: A good deal of the sales report will be data presentation and analysis. Make sure the data is broken down into smaller, manageable pieces. Remember, not everyone has spent as much time with the numbers as the creator of the report. Outline everything carefully for the reader.
- Interpretation of Results: The best sales reports always go a step further than the data itself; they explain what the data means. Effective sales reporting must include insight into what data, patterns, trends, and outliers mean for your organization and the industry as a whole.
Sales reports are number-heavy, but they require a definitively human touch. They are not all about raw data and computer-generated information. Great sales reporting is about analyzing the data and using it to drive results in future sales cycles.
6. Consider Your Audience
Once you have a solid grasp on the content you plan to present in your sales report, the last thing to consider is your audience. The intended reader of your sales report will help inform the way it’s designed.
Sales managers, for example, may expect a lot of KPIs throughout the sales report. C-suite executives, on the other hand, may care less about the numbers and prefer to focus on big-picture trends, forecasts, and trajectory numbers. Learn more about what your audience needs to know before you sit down to craft your report.
Regardless of their audience, sales reports should be aesthetically pleasing and easy to read. They should include lots of visual aids like graphs, charts, and images. Some CRM systems and other sales software platforms have easily-customizable sales reporting templates that can help you get started.
Creating an effective sales report can take some practice. You may find that it requires several iterations of the same report to determine the kind of information required to make it insightful and productive. Make sure you track your efforts and their results as you optimize the process of creating sales reports.
Tip: Make sure you have all the tools you need in your tech stack with this free blueprint.
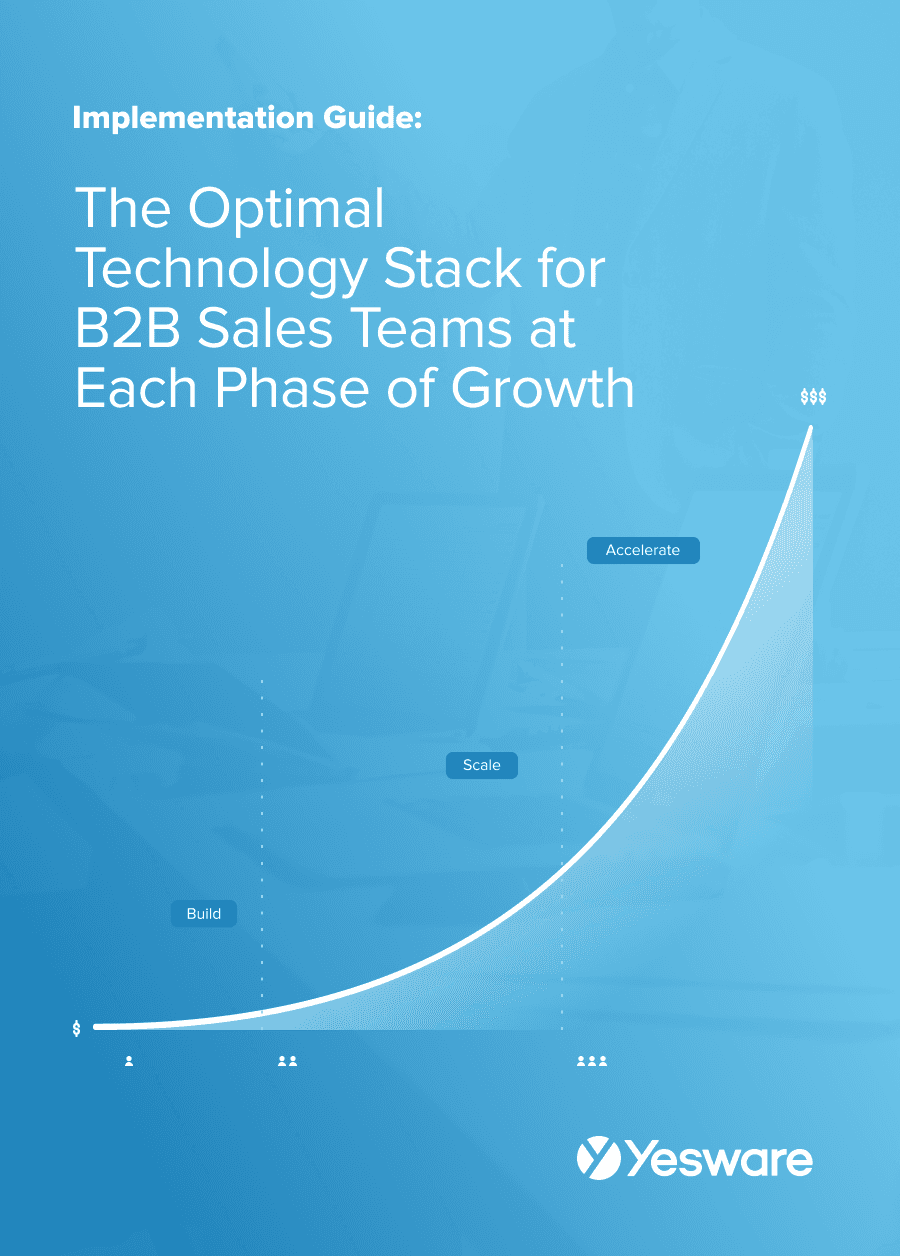 The Optimal Technology Stack for B2B Sales TeamsUsing data from the most successful business-scaling models, we designed a blueprint for the exact technology your business needs at each phase of growth.
How to Manage Your Sales Reports
Sales reports can only be useful if they’re accessible and tangible for everyone. Keep the following tips in mind to help manage your sales reports.
Standardize Data Collection and Submission
Effective sales reports rely on timely and accurate data. Make sure your team is aligned on how, when, and where to input what data (hint: sharing the “why” may help get buy-in).
Fortunately, many of today’s sales platforms make easy work of collecting and storing data. Still, it’s important that your sales reps understand the process and intent behind the automation they’re enabling. Give them the context they need to ensure they deliver on their data duties.
Store Them Carefully
As meticulous as you need to be with incoming data, it’s equally as important to remain fastidious with sales reports once they’re analyzed and implemented.
Maintain a clear process for organizing and storing past sales reports. Not only will this help your team keep track of them, but looking at a large collection of reports compiled over time can offer its own unique and valuable insight.
Encourage Honesty
Sales reports are only as effective as they are accurate. Make sure you’re creating a climate of trust and open reporting — even if results are subpar or discouraging.
Sales reports that illuminate dips in sales or other inefficiencies can be some of the most beneficial and productive, so make sure your sales reps know that their data will only be used in a positive, helpful way.
Sales Reporting Best Practices
Regardless of the specifics of your sales report, keep the following best practices in mind as you create and discuss them with your team.
Develop Templates
Sales dashboards, like most sales documents, are most effective when they’re consistent and predictable. For that reason, we recommend creating templates for your sales reports.
This isn’t to say that you should create a single, one-size-fits-all document that gets shoe-horned into every report you need. Remember, sales reports are inherently unique; there won’t be one template that meets their many needs.
But it’s okay to make a loose framework of components that you’ll need on every report or a general template for something like “Sales Forecasts.” The point here is to simplify the process to the best of your ability, so you’re not reinventing the wheel every time.
Follow a Schedule
By that same token, a schedule can simplify the process of creating and disseminating sales reports. A reliable sales reporting schedule can also help ensure that sales reps free up time in their calendar to really dig into new sales reports.
Use a Sales Dashboard
Sales dashboard software can be a powerful complement to any sales team’s reporting practices.
A sales dashboard can take a huge amount of data and streamline it into an aesthetically-pleasing, easy-to-read image. Like sales reports, sales dashboards can display several sets of data at once, making it easy to see connections and draw insight.
You might consider using a sales dashboard as a presentation tool as you discuss sales reports with your team.
Automate Sales Reporting with Yesware
Yesware integrates seamlessly with Gmail, Outlook, and Salesforce and lives directly in your inbox for real-time, up-to-the-second sales reports.
Our sales reporting tool gives sales reps data about the effectiveness of their outreach so that you’re always in-the-know of what content is/isn’t working.
Thanks to our integration with Salesforce, Yesware can pull data directly from your CRM to create reports on sales activity and pipeline progress.
Interested in trying Yesware? Try free here.
Do you use sales reports in your sales process? What types have you relied on so far? How can you improve your reporting process?
Looking for marketing reporting? Check out these guides: Client Reporting & Automated Client Reporting.
Get sales tips and strategies delivered straight to your inbox.
Yesware will help you generate more sales right from your inbox. Try our Outlook add-on or Gmail Chrome extension for free, forever!
Related Articles


Casey O'Connor
![Sales Velocity: What It Is + How to Calculate It [Examples]](/blog/_next/image/?url=https%3A%2F%2Fwww.yesware.com%2Fwp-content%2Fuploads%2F2022%2F03%2Fsales-velocity-yesware.jpg&w=1280&q=75)
Casey O'Connor

Casey O'Connor
Sales, deal management, and communication tips for your inbox